Key Considerations for Plasticizers Procurement: Sourcing, Quality, and Sustainability

Plasticizers Category - Procurement Intelligence 

The Plasticizers Category is anticipated to grow at a CAGR of 5.5% from 2023 to 2030. A plasticizer is a compound or material that is added to a polymer solution in order to enhance its flexibility and plasticity. In the plastics industry, plasticizers are among the most frequently utilized additives. The most common polymer to employ plasticizers is Polyvinyl Chloride (PVC), which is the third largest by volume after Polypropylene (PP) and Polyethylene (PE). Numerous chemical families fall under the category of plasticizers based on the classification of chemical composition. However, the most prevalent ones are - Trimellitate ester plasticizers (like TINTM, TIDTM, and TEHTM), Phthalate ester plasticizers (like DIDP, DINP, and DEHP), Energetic plasticizers (like BDNPA, BTTN, and DNT), Benzoate plasticizers (like benzoate esters), Adipate plasticizers (like DIDA and DEHA), Bio-based plasticizers (vegetable oil plasticizers), and Citrates plasticizers (like TOC, ATBC, and ATOC).

The growing demand for plasticizers from manufacturing and films & sheet industry, the robust growth in PVC demand, the increasing focus on sustainability, and the booming automotive industry are some of the major factors driving the category growth. The growing use of the product in electrical applications such as jacketing & insulation and medical applications such as blood bags and IV tubing owing to the emergence of new diseases are further aiding category expansion. An area of recent interest for researchers is the use of reactive plasticizers.

Order your copy of the Plasticizers Procurement Intelligence Report, 2023 - 2030, published by Grand View Research, to get more details regarding day one, quick wins, portfolio analysis, key negotiation strategies of key suppliers, and low-cost/best-cost sourcing analysis 

The polymers and in turn the plasticizers industry is highly fragmented. The nature of the polymer industry is such that it comprises a diverse range of specifications and end-user markets, leading to market fragmentation. It is even more complex in the recycled plastics industry. At the regional level, the plastics and polymers industry are primarily characterized by the presence of numerous small and micro-level players who dominate the market. All such factors increase the bargaining power of buyers. Many large companies/suppliers are now prioritizing the production of this substance using renewable technologies due to the increasing focus on sustainability. For instance, BASF’s plasticizer portfolio includes the use of renewable feedstocks, which can reduce carbon footprint by 60%. Other examples include: 

  • In September 2023, LANXESS took a significant step towards sustainability by introducing a new, eco-friendly plasticizer to replace its “Mesamoll” plasticizers. The eco-friendly product will be made using 30% raw materials sourced from sustainable sources. This move aims to reduce the carbon footprint of the product by 20%.
  • Similarly, in May 2021, Evonik introduced new sustainable plasticizers with 20 – 59% of recycled content. Its proprietary, “Eastman 168 Renew 20 non-phthalate” plasticizers use 20% certified recycled content for roofing and flooring applications. Its “Eastman Triacetin Renew 59” plasticizers have 59% recycled content for food packaging adhesives and other food wrap applications. Eastman is working towards producing plasticizers using its carbon renewal technology. 

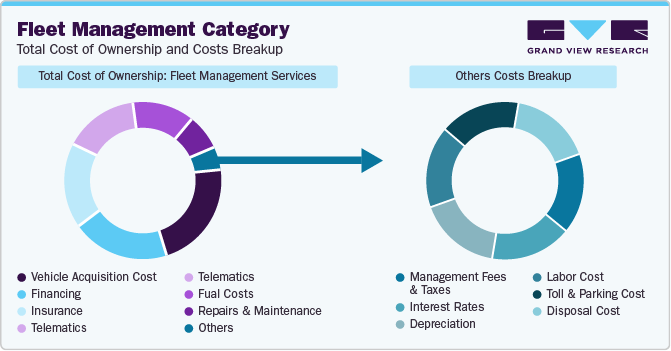
The key raw materials associated with the production of plasticizers are olefins, alcohols, and acids. Hence, the major cost components include raw materials, energy and equipment, labor, facilities and storage, and transportation. Other costs include utilities and administrative expenses, repairs and maintenance, testing, marketing, recycling, tax, insurance and depreciation, R&D, etc. A few common examples of olefins include butene or butylene, propene or propylene, etc. Fluctuations in the prices of raw materials can have a significant impact on the total cost of plasticizers. For instance, since July 2022, Eastman has increased its plasticizer prices due to ongoing pressure from raw materials, energy, and transportation costs. Price increases were in the range of USD 0.075 to USD 0.100 /LB in North America and Latin America.

List of Key Suppliers in the Plasticizers Category

  • Arkema S.A.
  • BASF SE
  • Daelim Industrial Co. Ltd.
  • Dow Chemical Company
  • LG Chem Ltd.
  • Evonik Industries AG
  • ExxonMobil Chemical
  • Eastman Chemical Company
  • INEOS Group
  • LANXESS AG
  • UPC Group

Plasticizers Procurement Intelligence Report Scope

  • Plasticizers Category Growth Rate: CAGR of 5.5% from 2023 to 2030 
  • Pricing Growth Outlook: 10% - 20% (Annually) 
  • Pricing Models: Volume-based, contract-based, and spot pricing model 
  • Supplier Selection Scope: Cost and pricing, past engagements, productivity, geographical presence 
  • Supplier Selection Criteria: Production capacity, grade, application area (polymeric, specialized), properties (weight, pressure, volume, boiling point), operational and functional capabilities, technology used, and others 
  • Report Coverage: Revenue forecast, supplier ranking, supplier positioning matrix, emerging technology, pricing models, cost structure, competitive landscape, growth factors, trends, engagement, and operating model 

Brief about Pipeline by Grand View Research: 

A smart and effective supply chain is essential for growth in any organization. Pipeline division at Grand View Research provides detailed insights on every aspect of supply chain, which helps in efficient procurement decisions. 

Our services include (not limited to): 

  • Market Intelligence involving – market size and forecast, growth factors, and driving trends
  • Price and Cost Intelligence – pricing models adopted for the category, total cost of ownerships
  • Supplier Intelligence – rich insight on supplier landscape, and identifies suppliers who are dominating, emerging, lounging, and specializing
  • Sourcing / Procurement Intelligence – best practices followed in the industry, identifying standard KPIs and SLAs, peer analysis, negotiation strategies to be utilized with the suppliers, and best suited countries for sourcing to minimize supply chain disruptions

Exploring the Top Cosmetic Dental Products Industry Vendors: A Complete Overview

Cosmetic Dental Products Industry Data Book - Teeth Whitening, Dental Implants, Dental Crown & Bridges and Dental Veneers Market Size, Share, Trends Analysis, and Segment Forecasts, 2023 - 2030

The global Cosmetic Dental Products Industry was estimated at USD 21.0 billion in 2022 and is anticipated to increase at a significant CAGR of 7.4% from 2023 to 2030.

Grand View Research, Cosmetic Dental Products industry databook collection of market sizing information & forecasts, regulatory data, reimbursement structure, competitive benchmarking analyses, macro-environmental analyses, and regulatory & technological framework studies. Within the purview of the database, all such information is systematically analyzed and provided in the form of presentations and detailed outlook reports on individual areas of research.

Dental Implants Market Insights

The global dental implants market size was valued at USD 4.6 billion in 2022 and is expected to grow at a compound annual growth rate (CAGR) of 9.8% from 2023 to 2030. Increasing applications of dental implants in various therapeutic areas along with rising demand for prosthetics are some of the key factors expected to boost the industry growth. Prosthetics play a major role in propelling the demand for these implants through oral rehabilitation, which helps in restoring the oral function and facial form of a patient. Acceptance level for dental implants is increasing among patients and dental surgeons due to limitations of removable prosthetics, such as discomfort, lack of natural appearance, and need for maintenance.

An increasing number of dental injuries, owing to road accidents and sports injuries, are also some of the major factors favoring the demand for dental implants. The World Health Organization (WHO) data suggests that nearly 10 million people are injured or disabled due to road accidents every year. In addition, according to the American Academy for Implant Dentistry, over 15 million people in the U.S. undergo bridge and crown replacements for missing teeth every year, thus facilitating the demand for dental implants. Dental implants are long-term replacements preserving adjacent teeth, which are ground in the case of bridges. It is considered the only restorative technique that preserves and stimulates natural bone and also acts as a stable support for prosthetics (dentures).

Moreover, dental implants improve the physical appearance of a person and provide comfort and convenience, unlike removable dentures. The U.S. held a substantial share in 2021 due to the growing number of dental implant placement procedures undertaken per year. For instance, each year, nearly 5 million implants are placed in the U.S. as per the American Dental Association. Moreover, as a developed region, the U.S. population has a higher affordability rate for dental implant procedures. High healthcare spending in this region is expected to propel market growth. Two of the major companies, named Biomet and DENTSPLY Sirona are headquartered in the U.S., which contributes to greater penetration of this market.

Order your copy of the Free Sample of “Cosmetic Dental Products Industry Data Book - Teeth Whitening, Dental Implants, Dental Crown & Bridges and Dental Veneers Market Size, Share, Trends Analysis, And Segment Forecasts, 2023 - 2030” Data Book, published by Grand View Research

Dental Veneers Market Size 2022 - 2030 (USD Million) & Market Attributes

Dental Veneers Market Insights

The global dental veneers market size was valued at USD 6.3 billion in 2022 and is expected to expand at a CAGR of 7.7% during the forecast period. The rapidly increasing demand for cosmetic procedures in dentistry is driving awareness about the products such as dental veneers. The rising occurrence of dental ailments, growing demand for restorative dental procedures, emerging dental tourism worldwide, and growing expendable income in developing countries are some of the key driving factors contributing to market growth. The dental care sector was significantly impacted at the beginning of the COVID-19 pandemic owing to the government-imposed social distancing guidelines.

The widespread explosion of extreme makeovers in the media channels gives the impression that the dental communities are in full support of this new era of cosmetic dental procedures. The simultaneous applications of the aesthetic aspect of dentistry along with the technical skills allow dental specialists to attain aesthetically functional results. The market's development is expected to be restrained by the hefty premium of dental imaging techniques, the paucity of insurance coverage for cosmetic operations, and the greater risks and difficulties involved with orthodontic and dental bridge procedures.

Moreover, the availability of innovative biomaterials and techniques has resulted in the development of newer approaches to managing dental disorders. The technologically advanced techniques are respectful of soft oral tissues. Cosmetic dentistry has transformed patient perspectives toward dental care. Cosmetic procedures such as dental veneers are gaining more demand, as patients are realizing that they are painless with satisfactory results. The quest for a better facial appearance has become equal to cosmetic intervention. Hence, the demand for cosmetic dentistry is growing at a rapid rate.

Go through the table of content of Cosmetic Dental Products Industry Data Book to get a better understanding of the Coverage & Scope of the study

Cosmetic Dental Products Industry Data Book Competitive Landscape

Companies are focusing on strategic initiatives, such as the introduction of novel products through customization according to consumers’ needs, partnerships, collaborations, and mergers & acquisitions, to expand their product portfolio and extend leadership positions in the field of dental implantology.

Key players operating in the Cosmetic Dental Products Industry are:

  • Colgate Palmolive
  • GlaxoSmithKline Plc
  • Johnson & Johnson.
  • Procter & Gamble
  • Brodie & Stone

Check out more Industry Data Books, published by Grand View Research

About Grand View Research

Grand View Research, U.S.-based market research and consulting company, provides syndicated as well as customized research reports and consulting services. Registered in California and headquartered in San Francisco, the company comprises over 425 analysts and consultants, adding more than 1200 market research reports to its vast database each year. These reports offer in-depth analysis on 46 industries across 25 major countries worldwide. With the help of an interactive market intelligence platform, Grand View Research helps Fortune 500 companies and renowned academic institutes understand the global and regional business environment and gauge the opportunities that lie ahead. 

Contact:

Sherry James
Corporate Sales Specialist, USA
Grand View Research, Inc.
Phone: 1-415-349-0058
Toll Free: 1-888-202-9519
Email: sales@grandviewresearch.com
Web: https://www.grandviewresearch.com/sector-reports-list
Follow Us: LinkedIn | Twitter

The Impact of Mergers and Acquisitions on the Single-Use Biomanufacturing Industry

Single-use Biomanufacturing Industry Data Book - Single-Use Bioprocessing, Bioreactor, Assemblies & Filtration Assemblies Market Size, Share, Trends Analysis, and Segment Forecasts, 2022 - 2030

The global Single-use Biomanufacturing Industry is anticipated to increase at a significant CAGR from 2022 to 2030.

Grand View Research’s Single-use Biomanufacturing Industry data book is a collection of market sizing & forecasts insights, market dynamics & trends, opportunity assessment, regulatory & technology framework, pricing intelligence, competitive benchmarking analyses, and macro-environmental analyses studies. Within the purview of the data book, such information is systematically analyzed and provided in the form of summary presentations and detailed outlook reports on individual areas of research.

Single-use Assemblies Market Insights

The global single-use assemblies market size was valued at USD 8.37 billion in 2021 and is expected to grow at a compound annual growth rate (CAGR) of 18.57% from 2022 to 2030. Single-use (SU) assemblies are preassembled plastic fluid paths and self-contained products. They are built with a combination of various standard components and are usually ready-to-use and gamma-irradiated to ensure sterility. Broadly used industrial products include sampling bottles, filters, tubings, check valves, clamps, sterile connectors, fittings, and seals. The growing biologics market, continuous technological innovations in bioprocessing, increasing biopharmaceutical R&D, and widespread adoption of single-use assemblies by various CMOs are expected to boost the industry growth during the forecast period.

The growing prevalence of cancer and infectious diseases is increasing the production of effective novel biologics options for the diagnosis and treatment of cancer. A rise in the cases of infectious diseases, such as lower respiratory infections and Human Immunodeficiency Virus (HIV), in recent years due to climate change, changing land-use patterns, and rapid urbanization are expected to aid in the industry growth. For instance, according to the WHO, lower respiratory infections ranked fourth place in causing deaths globally. According to UNAIDS, there were approximately 38.4 million cases of HIV across the globe in 2020.

Infectious diseases require effective diagnosis and treatment options, such as biologics, which, in turn, is expected to boost industry growth. Furthermore, novel developments in vaccines for various infectious diseases are expected to contribute to industry growth. For instance, in January 2022, Moderna launched a new clinical trial for an HIV vaccine that utilizes mRNA technology similar to that found in the company’s COVID-19 mRNA vaccine. This vaccine is aimed at the production of antibodies that can neutralize HIV particles and such attempts highlight the use of recently developed technologies in the biologics space.

Single-use Assemblies Market Size by Product, 2021 and 2030 (USD Billion)

Order your copy of the Free Sample of “Single-use Biomanufacturing Industry Data Book - Single-Use Bioprocessing, Bioreactor, Assemblies & Filtration Assemblies Market Size, Share, Trends Analysis, And Segment Forecasts, 2022 - 2030” Data Book, published by Grand View Research

Single-use Filtration Assemblies Market Insights

The global single-use filtration assemblies market size was valued at USD 2.43 billion in 2021 and is expected to expand at a compound annual growth rate (CAGR) of 18.7% from 2022 to 2030. The market has seen a surge in popularity as a result of their ability to provide a contamination-free solution to traditional stainless steel systems. These filtration assemblies are made using reinforced hose and welding applications, which eliminates the need for associated validation protocols and sterilization steps. Many biopharmaceutical companies are opting for single-use filtration assemblies for final and bulk fill operations due to the increased importance of maintaining sterile conditions. This has been driven by a growing demand for biopharmaceuticals, low risk of cross-contamination, faster implementation, and an increase in life sciences research and development activities.

The adoption of single-use technology in the pharmaceutical industry is driven by factors such as increased demand for personalized therapies, smaller batch sizes, and the need for flexible and scalable solutions. Single-use filtration systems provide a high degree of flexibility and versatility, allowing for easy and quick adaptation to changing requirements.In addition to their flexibility, single-use filtration systems are also cost-effective, which is anticipated to drive market growth.

Moreover, the increasing market player’s activities and rising adoption of various business strategies such as acquisition, partnerships, and product launches are also contributing to the growth of the market. For instance, in August 2022, Thermo Fisher launched the largest single-use technology manufacturing facility in Greater Nashville, with the aim of accelerating the production of its single-use technologies product, while also enabling pharmaceutical companies to deliver medicines to patients more quickly.

Go through the table of content of Single-use Biomanufacturing Industry Data Book to get a better understanding of the Coverage & Scope of the study

Single-use Biomanufacturing Industry Data Book Competitive Landscape

Competitive rivalry in the single-use bioprocessing market is high due to the presence of a substantial number of both well-established companies and small- to mid-sized companies as well as CROs in the industry.

Key players operating in the Single-use Biomanufacturing Industry are:

  • Danaher Corporation
  • Sartorius AG
  • Thermo Fisher Scientific, Inc.
  • Eppendorf SE
  • Corning Incorporated

Check out more Industry Data Books, published by Grand View Research

About Grand View Research

Grand View Research, U.S.-based market research and consulting company, provides syndicated as well as customized research reports and consulting services. Registered in California and headquartered in San Francisco, the company comprises over 425 analysts and consultants, adding more than 1200 market research reports to its vast database each year. These reports offer in-depth analysis on 46 industries across 25 major countries worldwide. With the help of an interactive market intelligence platform, Grand View Research helps Fortune 500 companies and renowned academic institutes understand the global and regional business environment and gauge the opportunities that lie ahead. 

Contact:

Sherry James
Corporate Sales Specialist, USA
Grand View Research, Inc.
Phone: 1-415-349-0058
Toll Free: 1-888-202-9519
Email: sales@grandviewresearch.com
Web: https://www.grandviewresearch.com/sector-reports-list
Follow Us: LinkedIn | Twitter

Top 10 Tips for Streamlining Your Fleet Management Procurement Process

Fleet Management Category - Procurement Intelligence 

The Fleet Management Category is anticipated to witness growth at a CAGR of 16.4% from 2023 to 2030. In 2022, North America accounted for 39% of the market share followed by Asia-Pacific and Europe. North America currently holds a dominant position in the global industry with the U.S. being a dominant nation in the region as it is home to several enormous market participants. Industry players support businesses working in different sectors by streamlining their fleet operations to reduce their operating expenses and offer various services such as fuel management, driver management & performance monitoring, vehicle maintenance, vehicle purchase/lease, funding, offering consultation, etc.

Technologies such as advanced driver assistance system (ADAS), electronic logging device (ELD) compliance system, artificial intelligence (AI), Internet of Things (IoT), machine learning (ML), and global positioning system (GPS) are playing a vital role in the development of fleet management category. Technological advancements in the industry have turned the optimization of operations fluidic and flexible, helping organizations save time and money. Through the use of fleet management systems (FMS), fleet managers may more effectively react to the changing conditions of the market.

Fleet Management Category: Total Cost of Ownership and Costs Breakup

Order your copy of the Fleet Management Procurement Intelligence Report, 2023 - 2030, published by Grand View Research, to get more details regarding day one, quick wins, portfolio analysis, key negotiation strategies of key suppliers, and low-cost/best-cost sourcing analysis 

The COVID-19 pandemic significantly affected industrial activities. Even though sectors such as field services, utility, logistics, and transportation opted for remote working policies, they operated at the fullest capacity to meet the need for essential services. The logistics and transportation sectors encountered enormous challenges as a result of this crisis and the ensuing disruptions in the supply chain. Key players witnessed a significant decline in their revenue during this period. Consequently, there was less of a need for fleets, drivers, dispatchers, planners, and other fleet operators. 

Fleet Management Sourcing Intelligence Highlights 

  • The global fleet management category is highly fragmented, with top players in the market being based out of North America, Europe, and Asia Pacific, and are continuously expanding their service portfolio and scale to stay competitive by getting an edge over the others across the globe.
  • The U.S. is the largest nation in Fleet Management Services due to the presence of a large number of global players.
  • Despite being a competitive industry, fleet management companies (FMCs) in the industry have low negotiating capability as there is high competition and the buyers can easily switch to a different supplier.
  • Vehicle acquisition cost, financing, insurance, telematics, fuel costs, and repair & maintenance are the key cost components of Fleet Management. Other costs include management fees & taxes, interest rates, depreciation, labor costs, toll & parking costs, and disposal costs.

List of Key Suppliers in the Fleet Management Category

  • ALD SA (ALD International)
  • Arval Service Lease
  • Donlen LLC
  • Element Fleet Management Corp.
  • Ewald Fleet Solutions
  • Executive Trust Limited (Europcar Ireland)
  • Holman, Inc.
  • Mike Albert Leasing, Inc.
  • Mobilease, LLC
  • ORIX Corporation
  • The Hertz Corporation
  • Wheels, LLC

Fleet Management Procurement Intelligence Report Scope

  • Fleet Management Category Growth Rate: CAGR of 16.4% from 2023 to 2030 
  • Pricing Growth Outlook: 5% - 10% (Annually) 
  • Pricing Models: Cost plus pricing model, fixed price pricing model 
  • Supplier Selection Scope: Cost and pricing, past engagements, productivity, geographical presence 
  • Supplier Selection Criteria: Years of experience, geographical service provision, industries served, fleet acquisition/leasing, outsourced driver management, fleet management, sale & leaseback, technology, consulting, and other factors 
  • Report Coverage: Revenue forecast, supplier ranking, supplier matrix, emerging technology, pricing models, cost structure, competitive landscape, growth factors, trends, engagement, and operating model 

Brief about Pipeline by Grand View Research: 

A smart and effective supply chain is essential for growth in any organization. Pipeline division at Grand View Research provides detailed insights on every aspect of supply chain, which helps in efficient procurement decisions. 

Our services include (not limited to): 

  • Market Intelligence involving – market size and forecast, growth factors, and driving trends
  • Price and Cost Intelligence – pricing models adopted for the category, total cost of ownerships
  • Supplier Intelligence – rich insight on supplier landscape, and identifies suppliers who are dominating, emerging, lounging, and specializing
  • Sourcing / Procurement Intelligence – best practices followed in the industry, identifying standard KPIs and SLAs, peer analysis, negotiation strategies to be utilized with the suppliers, and best suited countries for sourcing to minimize supply chain disruptions

Breast Pump and Breastfeeding Accessories Industry Trends, 2022 - 2030

Breast Pump and Breastfeeding Accessories Industry Data Book - Breast Pump, Wearable Breast Pump & Breastfeeding Accessories Market Size, Share, Trends Analysis, And Segment Forecasts, 2022 - 2030

The global Breast Pump and Breastfeeding Accessories Industry was valued at USD 4.06 billion in 2021 and is anticipated to increase at a significant CAGR of 7.8% from 2022 to 2030.

Grand View Research’s breast pump & breastfeeding accessories industry data book is a collection of market sizing information & forecasts, regulatory data, reimbursement structure, competitive benchmarking analyses, macro-environmental analyses, and regulatory & technological framework studies. Within the purview of the database, all such information is systematically analyzed and provided in the form of presentations and detailed outlook reports on individual areas of research.

Breast Pump Market Insights

The global breast pump market size was estimated at USD 1.84 billion in 2021 and is projected to grow at a compound annual growth rate (CAGR) of 8.3% from 2022 to 2030. The key factors driving market growth include rising global women's employment rates, improved healthcare infrastructure in emerging economies, and government initiatives to support working mothers. The International Labor Organization (ILO) reports that there has been visible progress in terms of employment opportunities and gender equality over the last 20 years. The ILO initiated the 2030 United Nations Agenda, which declares that the genders of youth and the disabled population are likely to have equal pay without discrimination to achieve gender equality and empower all women and girls to attain productive employment, gender equality, and economic development.

Growing consumer awareness and supportive government initiatives are anticipated to propel the global demand for breast pumps. For instance, The Baby Friendly Hospital Initiative (BFHI), which promotes evidence-based practices for breastfeeding success, was established by the United Nations Children's Fund (UNICEF) and the World Health Organization (WHO) to enhance breastfeeding rates and assist families in achieving their breastfeeding goals. Similarly, most insurance plans must now cover specified breastfeeding help and supplies, such as breast pumps, as part of the Affordable Care Act. Therefore, such initiatives are expected to increase the usage of these products. As a result, purchasing these products becomes easier for end-users, leading to rising demand for breast pumps.

The breast pump helps improve accessibility to perform tasks in daily living. A breast pump is covered under Medicare but does not cover disposable items. Medicare Part-B beneficiaries pay 20% of the approved cost of the product, and Medicare pays the remaining 80%. Better coverage and reimbursement policies for breast pump products are also likely to help boost the market growth. In addition, the rising number of elderly care centers because of the increasing geriatric population base globally is projected to drive the market further.

Breast Pump Market Growth by Technology Segments, and Trends, 2020 - 2030 (USD Million)

Order your copy of the Free Sample of “Breast Pump and Breastfeeding Accessories Industry Data Book - Breast Pump, Wearable Breast Pump & Breastfeeding Accessories Market Size, Share, Trends Analysis, And Segment Forecasts, 2022 - 2030” Data Book, published by Grand View Research

Breastfeeding Accessories Market Insights

The global breastfeeding accessories market size was estimated at USD 2.2 billion in 2021 and is projected to grow at a compound annual growth rate (CAGR) of 6.4% from 2022 to 2030. The demand for breastfeeding accessories is increasing owing to a rise in the global women’s employment rate. Furthermore, an increase in awareness campaigns by government and market players regarding the availability of breastfeeding accessories is anticipated to propel the market growth during the forecast period.

For instance, various market players such as Medela LLC, Laura & Co., Newell Brands, and Ameda, along with universities including Washington University and Fudan University, are raising awareness among women regarding breastfeeding and its benefits by arranging campaigns and providing informative magazines. In addition, social media platforms such as YouTube, Facebook, and Instagram have enabled individuals to access information about breastfeeding and related accessories.

Similarly, an increasing number of milk banks around the globe is predicted to propel the market growth further. Due to the high demand for breast milk storage, the number of milk banks is increasing. Milk banks are beneficial for mothers and are considered a progressive initiative. Milk banks can offer major advantages in cases such as if the mother is infected with a risk of disease transmission, the mother is unable to lactate, or the baby is orphaned. Thus, an increase in the number of milk banks may increase the use of breastfeeding accessories, thereby driving the market growth over the forecast period.

Go through the table of content of Breast Pump and Breastfeeding Accessories Industry Data Book to get a better understanding of the Coverage & Scope of the study

Breast Pump and Breastfeeding Accessories Industry Data Book Competitive Landscape

The market players are focused on research and development activities to develop technologically advanced products to gain a competitive edge.

Key players operating in the Breast Pump and Breastfeeding Accessories Industry are:

  • Ameda (Magento, Inc.)
  • Hygeia Health
  • Medela Ag
  • Koninklijke Philips N.V.
  • Lansinoh Laboratories, Inc.

Check out more Industry Data Books, published by Grand View Research

About Grand View Research

Grand View Research, U.S.-based market research and consulting company, provides syndicated as well as customized research reports and consulting services. Registered in California and headquartered in San Francisco, the company comprises over 425 analysts and consultants, adding more than 1200 market research reports to its vast database each year. These reports offer in-depth analysis on 46 industries across 25 major countries worldwide. With the help of an interactive market intelligence platform, Grand View Research helps Fortune 500 companies and renowned academic institutes understand the global and regional business environment and gauge the opportunities that lie ahead. 

Contact:

Sherry James
Corporate Sales Specialist, USA
Grand View Research, Inc.
Phone: 1-415-349-0058
Toll Free: 1-888-202-9519
Email: sales@grandviewresearch.com
Web: https://www.grandviewresearch.com/sector-reports-list
Follow Us: LinkedIn | Twitter

Key Trends and Market Predictions for the Electric Mobility Industry

Electric Mobility Industry Data Book - Two-Wheeler, Three-Wheeler and Light Commercial Vehicles Market Size, Share, Trends Analysis, and Segment Forecasts, 2023 - 2030

The global Electric Mobility Industry was valued at USD 101.67 billion in 2022 and is anticipated to increase at a significant CAGR of 19.9% from 2023 to 2030.

Grand View Research’s electric mobility industry data book is a collection of market sizing information & forecasts, regulatory data, reimbursement structure, competitive benchmarking analyses, macro-environmental analyses, and regulatory & technological framework studies. Within the purview of the database, all such information is systematically analyzed and provided in the form of presentations and detailed outlook reports on individual areas of research.

Electric Three-Wheeler Market Insights

The global electric three wheeler market size was valued at USD 1.28 billion in 2022 and is anticipated to register a compound annual growth rate (CAGR) of 7.7 % during the forecast period. The market is expected to experience growth owing to the rising inclination towards electric vehicles over conventional vehicles powered by fossil fuel. The growing concentration of greenhouse gases in the environment has promoted society to look for sustainable modes of transportation options, especially electric three-wheeler vehicles. Moreover, new startups such as Nobecars, Arcimoto, and others are booming in the electric three-wheeler landscape, further driving the market growth.

Electric vehicles are becoming a part of the mainstream vehicle fleets worldwide. To make electric three-wheelers more efficient, their powertrain and battery technologies are being improved. To make electric three-wheelers more affordable, manufacturers are developing a scalable electric solution for three-wheelers which will help in the cost-effective electrification of conventional vehicles specially used for last mile connectivity. The electric mobility ecosystem has been developing to accommodate more electric vehicles based on the transportation choices of various end-users. With electric light commercial three-wheelers fleets being increasingly used for last-mile delivery of cargo. 

The absence of standard charging infrastructure and high battery costs are major restraints hindering the electric three-wheeler market growth. The limited presence of charging infrastructures, such as standardized charging plugs and standardized charging capacity parameters, is fueling the vehicle range anxiety for drivers. Additionally, safety concerns over lithium-ion batteries catching fire are further restraining the market growth. This is promoting the government worldwide to draft more stringent regulations concerning safety standards to be implemented during manufacturing batteries and other components.

Electric Three-wheeler Market Size by Power Type, 2020 - 2030 (USD Billion)

Order your copy of the Free Sample of “Electric Mobility Industry Data Book - Two-Wheeler, Three-Wheeler and Light Commercial Vehicles Market Size, Share, Trends Analysis, And Segment Forecasts, 2023 - 2030” Data Book, published by Grand View Research

Electric Light Commercial Vehicles Market Insights

The global Electric Light Commercial Vehicles Market size was valued at USD 9.30 billion in 2022 and is expected to expand at a compound annual growth rate (CAGR) of 39.0% from 2023 to 2030. Increasing demand for the lightweight, fuel-efficient, and cost-effective vehicle for the transportation of goods is fueling the growth of light commercial vehicles such as pick-up trucks, vans and minibus in the market. Additionally, the booming e-commerce sector is further creating demand for the logistics transportation service, an electric light commercial vehicle which offers tax incentives, contributes to reducing fuel emission, and are affordable. Thus, LCVs are widely preferred for door-to-door delivery, pick, and drop, and shipping service in the market.

In addition, some of automobile parts manufacturers are working on developing the technology advanced solution for electric light commercial vehicle manufacturers. For instance, in 2022, ZF Friedrichshafen AG, has launched solid rear axle for pick-up trucks, which has integrated electric drivetrains. The company-produced an e-Beam e- axle comprised of the power inverter, e- motor, transmission, axle assembly a complete solution for pick-up trucks. Also, the embedded battery packs have a faster charging option. Further, the ZF e-beam axle is paired with the ZF’s Active Kinematic Control rear-wheel steering system, which reduces the turning radius of the vehicle. Therefore, these innovations and technological advancement is parts will improve overall efficiency and performance of the E- light commercial vehicle thereby contributing to creating new growth opportunity for market growth.

Asia Pacific region is expected to hold the highest share in the electric three-wheeler market. Factors such as EVs as an eco-friendly and affordable option for public transport, increasing popularity of shared mobility, and active government backing for the adoption of EVs are contributing to high regional share. The region has a high penetration of electric three-wheelers, prompting manufacturers to adopt strategies such as partnerships and launching new e-three-wheeler models to gain market share. For instance, Omega Kesiki Mobility entered the passenger electric three-wheeler segment with the launch of Stream, which is priced at INR 3.40 lakhs after government subsidy.

Go through the table of content of Electric Mobility Industry Data Book to get a better understanding of the Coverage & Scope of the study

Electric Mobility Industry Data Book Competitive Landscape

The market players across the Electric Mobility industry are continuously pursuing various initiatives such as strategic partnerships, mergers and acquisitions, and new product launches. These vendors hold expertise in the industry and have strategic footprints spread across various parts of the world. Hence, these companies have been able to successfully defend their position in the market.

Key players operating in the Electric Mobility Industry are:

  • AIMA Technology Group Co. Ltd.
  • Greeves Electric mobility Private Limited (Ampere Vehicles)
  • Bird Rides, Inc.
  • Ideanomics, Inc.
  • Hero Electric (Hero Eco Group)

Check out more Industry Data Books, published by Grand View Research

About Grand View Research

Grand View Research, U.S.-based market research and consulting company, provides syndicated as well as customized research reports and consulting services. Registered in California and headquartered in San Francisco, the company comprises over 425 analysts and consultants, adding more than 1200 market research reports to its vast database each year. These reports offer in-depth analysis on 46 industries across 25 major countries worldwide. With the help of an interactive market intelligence platform, Grand View Research helps Fortune 500 companies and renowned academic institutes understand the global and regional business environment and gauge the opportunities that lie ahead. 

Contact:

Sherry James
Corporate Sales Specialist, USA
Grand View Research, Inc.
Phone: 1-415-349-0058
Toll Free: 1-888-202-9519
Email: sales@grandviewresearch.com
Web: https://www.grandviewresearch.com/sector-reports-list
Follow Us: LinkedIn | Twitter

Managed Mobility Services Procurement Revenue Forecast Report, 2023 - 2030

Managed Mobility Services Category - Procurement Intelligence 

The Managed Mobility Services (MMS) Category is anticipated to grow at a CAGR of 23.8% from 2023 to 2030. In 2022, the North American region dominated the category with a share of 37%. An organization's MMS includes a variety of IT and workflow management services that are needed for purchasing, allocating, and maintaining tablets, smartphones, and other associated gadgets/devices. According to Microsoft, more than 52% of employees preferred shifting to remote work by the end of 2022. The increasing number of employees operating remotely, the rise in IoT-connected devices, the increasing use of BYOD owing to hybrid work models, and the growing requirement for tight security measures are some of the factors driving the growth of the MMS category. By function, in 2022, the device management segment accounted for the largest share, between 50% - 60% of the overall share.

Another factor aiding growth is the increasing telecom expense management (TEM). TEM companies have become a crucial asset in this hybrid working model. 2021 saw this hybrid mode become a norm rather than an exception. According to Gartner's 2022 report, TEM companies have evolved their offerings since 2021 to meet the increased demand and handle the complex network of mobile and fixed assets. In 2022, enterprises have partnered with TEM companies that offer complete lifecycle support - from procurement to invoicing, vendor, and inventory management.

Order your copy of the Managed Mobility Services Procurement Intelligence Report, 2023 - 2030, published by Grand View Research, to get more details regarding day one, quick wins, portfolio analysis, key negotiation strategies of key suppliers, and low-cost/best-cost sourcing analysis 

One of the trends in this category is the rising use and deployment of 5G networks in emerging countries such as Brazil, Mexico, India, Malaysia, etc. For instance, in Q1 2022, Telcel launched 5G services in Mexico using a 3.5g spectrum. Similarly, in Q4 2022, Jio and Airtel launched 5G networks in India. This has, in turn, forced many MMS companies to evolve their offerings in these regions to meet the demand. 

The global managed mobility service industry is fragmented overall. It has been found that for accessibility to company applications, 87% of organizations rely on their employees to utilize their individual mobile devices. In recent times, more than 70% of companies have BYOD-to-work policies. Hence, a multitude of MMS providers has emerged over the last two to three years to assist businesses in handling the proliferation of mobile devices that access private networks and company-sensitive information. 

Vendors in this category are trying to provide end-to-end unified solutions, full support for BYOD and cross-device integration, device compatibility, and sophisticated security tools and services. This is to ensure that a high level of data integrity is maintained while protecting the company’s (clients) full device portfolio. Telecom network operators, device developers, MMS service and platform vendors (pure play or combined), and cloud service providers (or, CSPs) are a few instances of the major types of suppliers in this category. The bargaining power of suppliers is reduced due to increased fragmentation.

List of Key Suppliers in the Managed Mobility Services Category

  • AT&T Inc.
  • Fujitsu Limited
  • Orange S.A.
  • Telefónica, S.A.
  • Deutsche Telekom AG
  • Kyndryl Holdings, Inc.
  • Vodafone Group plc
  • IBM Corporation
  • Cisco Systems, Inc.
  • Zebra Technologies Corporation
  • Honeywell International Inc.
  • Verizon Communications Inc.

Managed Mobility Services Procurement Intelligence Report Scope

  • Managed Mobility Services Category Growth Rate: CAGR of 23.8% from 2023 to 2030 
  • Pricing Growth Outlook: 10% - 15% (Annually) 
  • Pricing Models: Bundled pricing, user-based pricing, or contract-based pricing. 
  • Supplier Selection Scope: Cost and pricing, past engagements, productivity, geographical presence 
  • Supplier Selection Criteria: End-to-end solutions, cloud solutions, compliance, optimization services, platforms, IoT solutions, analytics and security, device support, operational and functional capabilities, technology used, and others 
  • Report Coverage: Revenue forecast, supplier ranking, supplier positioning matrix, emerging technology, pricing models, cost structure, competitive landscape, growth factors, trends, engagement, and operating model 

Brief about Pipeline by Grand View Research: 

A smart and effective supply chain is essential for growth in any organization. Pipeline division at Grand View Research provides detailed insights on every aspect of supply chain, which helps in efficient procurement decisions. 

Our services include (not limited to): 

  • Market Intelligence involving – market size and forecast, growth factors, and driving trends
  • Price and Cost Intelligence – pricing models adopted for the category, total cost of ownerships
  • Supplier Intelligence – rich insight on supplier landscape, and identifies suppliers who are dominating, emerging, lounging, and specializing
  • Sourcing / Procurement Intelligence – best practices followed in the industry, identifying standard KPIs and SLAs, peer analysis, negotiation strategies to be utilized with the suppliers, and best suited countries for sourcing to minimize supply chain disruptions

Unpacking the Profit Margin in the Flavors & Fragrances Industry: What You Need to Know

Flavors & Fragrances Industry Data Book - Natural Flavors & Fragrances and Aroma Chemicals Market Size, Share, Trends Analysis, and Segment Forecasts, 2023 - 2030

The global Flavors & Fragrances Industry was valued at USD 23.35 billion in 2021 and is anticipated to increase at a significant CAGR of 4.3% from 2022 to 2030.           

Grand View Research’s Flavors & Fragrances industry databook is a collection of market sizing information & forecasts, trade data, pricing intelligence, competitive benchmarking analyses, macro-environmental analyses, and regulatory & technological framework studies. Within the purview of the database, such information is systematically analyzed and provided in the form of outlook reports (1 detailed sectoral outlook report) and summary presentations on individual areas of research along with a statistics e-book.

Natural Flavors & Fragrances Market Insights

The global natural flavors and fragrances market was valued at USD 8,510.4 million in 2022 and is anticipated to expand at a compound annual growth rate (CAGR) of 4.6% from 2023 to 2030. The growth is driven by the growing demand for the product in convenience food and packaged food items. The industry growth was hampered amid the COVID-19 pandemic, as there were several restrictions on the import and export of chemicals coupled with quarantine and lockdown measures acting as some of the key barriers faced by several product manufacturers. The pandemic directly impacted people’s choices, lifestyles, preferences, health, and well-being.

Due to the shortage of labor owing to health concerns, many companies had to shut down their manufacturing units for a long period. Natural fragrances and flavors are derived from natural sources, such as plants and animals. These sources include vegetables, fruits, meat, spices, fish, roots, leaves, and more. It contains rich properties of fruits or vegetables that can be used for various purposes, such as adding flavor to food or instilling fragrance in beverages. Furthermore, natural flavors & fragrances are extensively consumed in the preparation of convenience foods. Food & beverage-producing companies tend to rely on these products owing to their organic nature and less harmful chemical content.

The increasing population coupled with the high disposable individual income in countries like the U.S., the U.K., China, India, Brazil, and South Africa has elevated the consumption of convenience or packaged foods & beverages, such as bakery products, dietary food, flavored drinks, and more. In addition, pharmaceutical companies are producing medicines that are sweet and acceptable to a vast majority of the population. Predominantly for children, the companies tend to mask the bitter taste of medicines with fragrances & flavors to make them easily consumable. Rising awareness about child health is likely to be a major factor stimulating the demand for natural fragrances & flavors in the pharmaceutical industry.

Natural Flavors & Fragrances Consumption share, by product, 2022 (%)

Order your copy of the Free Sample of “Flavors & Fragrances Industry Data Book - Natural Flavors & Fragrances and Aroma Chemicals Market Size, Share, Trends Analysis, And Segment Forecasts, 2023 - 2030” Data Book, published by Grand View Research

Aroma Chemicals Market Insights

The global aroma chemicals market size was valued at USD 15,639.1 million in 2022 and is expected to expand at a compound annual growth rate (CAGR) of 3.3% from 2023 to 2030. The growth is attributed to increased consumption of flavors & fragrance products in the cosmetics & toiletries, soaps & detergents, and food & beverages industries. Aroma chemicals are witnessing an increase in demand owing to the growing application scope in key end-use industries such as dairy, cosmetics & toiletries, soaps & detergents, fine fragrances, convenience foods, bakery foods, and confectionery. Moreover, increasing demand for low calories drinks and growth in the beverages market, are the major factors driving the growth of the industry.

Flavors being a prominent factor in taste in edible products, aroma chemicals are utilized to augment the taste in beverages and processed food. Increasing demand for health and wellness foods, regulation, and the ban on the use of some synthetic flavors are triggering the growth of natural aroma chemicals. The suitability of natural flavors in wider applications, additional health benefits of certain natural flavors, and advanced technological innovation are the key factors driving the market growth.

Customers are reallocating their finances from non-essentials to stockpile essentials, including disinfectants and hygiene and cleaning products. In India, the immediate impact of COVID-19 on hygiene product categories was recorded in March 2020. The hygiene products category witnessed an increase of 25% and 60% in demand for floor cleaners and hand washes, respectively. All these factors contribute significantly to the demand for aroma chemicals used in soaps and detergents.

Go through the table of content of Flavors & Fragrances Industry Data Book to get a better understanding of the Coverage & Scope of the study

Flavors & Fragrances Industry Data Book Competitive Landscape

The market players across the flavors & fragrances industry were able to maintain good momentum and cope with the challenges associated with operations and supply chain disruptions.

Key players operating in the Flavors & Fragrances Industry are:

  • Givaudan
  • Symrise AG
  • International Flavors & Fragrances Inc. (IFF)
  • Biolandes SAS
  • Young Living Essential Oils

Check out more Industry Data Books, published by Grand View Research

About Grand View Research

Grand View Research, U.S.-based market research and consulting company, provides syndicated as well as customized research reports and consulting services. Registered in California and headquartered in San Francisco, the company comprises over 425 analysts and consultants, adding more than 1200 market research reports to its vast database each year. These reports offer in-depth analysis on 46 industries across 25 major countries worldwide. With the help of an interactive market intelligence platform, Grand View Research helps Fortune 500 companies and renowned academic institutes understand the global and regional business environment and gauge the opportunities that lie ahead. 

Contact:

Sherry James
Corporate Sales Specialist, USA
Grand View Research, Inc.
Phone: 1-415-349-0058
Toll Free: 1-888-202-9519
Email: sales@grandviewresearch.com
Web: https://www.grandviewresearch.com/sector-reports-list
Follow Us: LinkedIn | Twitter

Uncovering the Pharmaceutical Packaging Industry's Supply-Demand Gap Analysis

Pharmaceutical Packaging Industry Data Book - Plastic Pharmaceutical Packaging, Parenteral Containers, Primary Pharmaceutical Packaging and Pharmaceutical Contract Packaging Market Size, Share, Trends Analysis, and Segment Forecasts, 2023 - 2030

The global Pharmaceutical Packaging Industry was valued at USD 117,007.3 million in 2021 and is anticipated to increase at a significant CAGR from 2022 to 2030.           

Grand View Research’s pharmaceutical packaging industry databook is a collection of market sizing information & forecasts, trade data, pricing intelligence, competitive benchmarking analyses, macro-environmental analyses, and regulatory & technological framework studies. Within the purview of the database, such information is systematically analyzed and provided in the form of outlook reports (1 detailed sectoral outlook report) and summary presentations on individual areas of research along with a statistics e-book.

Plastic Pharmaceutical Packaging Market Insights

The global Plastic Pharmaceutical Packaging Market size was valued at USD 43,377.7 million in 2021 and it is expected to expand at a compound annual growth rate (CAGR) of 9.1% from 2022 to 2030. Plastic is light in weight, easy to mold, and considerably cheaper than metal and glass. Therefore, end-use companies majorly prefer plastic-based packaging products. Increasing demand for convenience, lightweight, and travel-friendly packaged pharmaceutical products from this industry is expected to augment the growth of the plastic & polymers material segment in the coming years.

Polypropylene (PP) accounted for the largest share in the plastic & polymers material segment in 2022. Polypropylene is considered an economical material as it offers a combination of mechanical, physical, electrical, and thermal characteristics that are not found in any other thermoplastic. When compared to high or low-density polyethylene, polypropylene exhibits a higher working temperature and tensile strength.

PET accounted for the second-largest share in the plastic & polymers segment in 2020 and is expected to witness significant growth over the forecast period. PET is used for the packaging of liquid oral drug formulations and is the most used and globally accepted form of plastic for the packaging of pediatric and geriatric drugs. This is attributed to its transparency, robustness, low cost, and lightweight.

Plastic Pharmaceutical Packaging Consumption Share, by country, 2022 (%)

Order your copy of the Free Sample of “Pharmaceutical Packaging Industry Data Book - Plastic Pharmaceutical Packaging, Parenteral Containers, Primary Pharmaceutical Packaging and Pharmaceutical Contract Packaging Market Size, Share, Trends Analysis, And Segment Forecasts, 2023 - 2030” Data Book, published by Grand View Research

Primary Pharmaceutical Packaging Market Insights

The global Primary Pharmaceutical Packaging Market size was valued at USD 88,504.2 million in 2021 and is projected to grow a CAGR of 9.7% from 2022 to 2030. The Primary packaging first envelopes the drug and protects it from contamination. Along with protection, primary packaging used in this industry is often involved in dispensing and dosing drug contents. Labels containing information regarding drug use, caution, and others are often printed or attached to primary packaging products such as bottles, pouches, tubes, vials, blister packs, and others.

Primary pharmaceutical packaging is expected to emerge as the largest segment over the forecast period. This can be contributed to factors such as minimal product-package interaction, protection of quality, and enhanced performance at point-of-use. In addition, ease-of-use for the patient is a major driving factor for the primary packaging segment on account of the increasing trend of self-medication. Further, the complex needs of the rapidly growing biologics market are spurring developments in parenteral packaging.

Key companies operating in the primary this market includes Amcor plc, Becton, Dickinson and Company, AptarGroup, Inc., Drug Plastics Group, Gerresheimer AG, Schott AG, Owens Illinois Inc., SGD Pharma, West Pharmaceutical Services, Inc., Berry Global Inc., WestRock Company, Comar, LLC, and Vetter Pharma International.

Go through the table of content of Pharmaceutical Packaging Industry Data Book to get a better understanding of the Coverage & Scope of the study

Pharmaceutical Packaging Industry Data Book Competitive Landscape

The global pharmaceutical packaging market is highly fragmented with the presence of large and medium-sized international companies as well as small-sized domestic players. The global market is steadily moving toward sustainable packaging owing to rising stringent regulations regarding the use of excessive plastic packaging coupled with growing sustainability awareness among consumers.

Key players operating in the Pharmaceutical Packaging Industry are:

  • Amcor plc
  • Becton, Dickinson and Company
  • AptarGroup, Inc.,
  • Drug Plastics Group
  • Gerresheimer AG

Check out more Industry Data Books, published by Grand View Research

About Grand View Research

Grand View Research, U.S.-based market research and consulting company, provides syndicated as well as customized research reports and consulting services. Registered in California and headquartered in San Francisco, the company comprises over 425 analysts and consultants, adding more than 1200 market research reports to its vast database each year. These reports offer in-depth analysis on 46 industries across 25 major countries worldwide. With the help of an interactive market intelligence platform, Grand View Research helps Fortune 500 companies and renowned academic institutes understand the global and regional business environment and gauge the opportunities that lie ahead. 

Contact:

Sherry James
Corporate Sales Specialist, USA
Grand View Research, Inc.
Phone: 1-415-349-0058
Toll Free: 1-888-202-9519
Email: sales@grandviewresearch.com
Web: https://www.grandviewresearch.com/sector-reports-list
Follow Us: LinkedIn | Twitter

Is Fiber Reinforced Plastics Procurement on the Rise? A Growth Analysis

Fiber Reinforced Plastics Category - Procurement Intelligence 

The Fiber Reinforced Plastics Category is anticipated to grow at a CAGR of 8% from 2023 to 2030. North America holds the largest market for this category. The demand for Fiber Reinforced Plastics (FRP) has increased in recent years due to their advantages, such as a high strength-to-weight ratio and corrosion resistance, which have made them suitable for use in a variety of environments. Applications of FRPs include the automotive, aerospace, and construction industries.

The expansion can be attributed to the rise in demand for strong, lightweight materials in the construction, marine, aerospace, and automotive industries. The demand for FRP products in a variety of applications is also being fueled by strict environmental protection rules. Other significant growth drivers are rapid urbanization and industrialization, rising consumer disposable income in developing nations such as Middle East & Africa, and increasing government investments in infrastructure development.

This category has experienced significant technological advancements in the past few years, including the development of innovative fiber materials like carbon fiber and aramid fiber, which are stronger and lighter than traditional fibers. Additionally, new manufacturing techniques like additive manufacturing (AM) have enabled the production of complex FRP parts with high accuracy and repeatability, opening up new possibilities in industries such as aerospace, automotive, and medical. Furthermore, advancements in FRP composite design and testing have resulted in stronger, lighter, and more durable composites.

Order your copy of the Fiber Reinforced Plastics Procurement Intelligence Report, 2023 - 2030, published by Grand View Research, to get more details regarding day one, quick wins, portfolio analysis, key negotiation strategies of key suppliers, and low-cost/best-cost sourcing analysis 

This category is partially consolidated with the presence of both global and regional players. The large players have the resources to acquire smaller players, develop new products, and expand into new markets. However, the smaller players can compete by focusing on specific market segments or by offering customized solutions. Key players in this category use acquisitions, product development, and expansion to consolidate positions, meet market demand, and gain a competitive edge. 

  • In August 2022, in order to meet the rising demand for the company's assortment of fiber-reinforced polymer (FRP) materials, Vixen Composites, an Airxcel brand, has expanded into a new larger 60,000-square-foot facility in Aeroplex Industrial Park, Indiana, in the United States. 
  • In April 2022, a glass fiber reinforced polymer (GFRP) production line for fiberglass rebar was built by SK Eco plant in collaboration with KCMT, a Korean GFRP producer. By 2024 and 2027, the joint factory will be able to produce 40,000 tons and 200,000 tons annually, respectively. 
  • In September 2021, Penn State College of Engineering researchers developed a low-cost CFRP manufacturing technology using a vacuum bag and carbon fibers. This innovative method, funded by the US Office of Naval Research, could reduce fuel consumption and increase cargo weight allowances for commercial airlines. 

This category has major cost components based on specific operations. These components include raw materials, labor and manufacturing, research and development, transportation, regulatory compliance, and maintenance. Raw materials constitute a substantial portion (50%) of the cost, with fiber and resin being paramount. Glass fiber, carbon fiber, and aramid fiber are common fibers, while polyester, vinyl ester, and epoxy resins are frequently used. Labor and manufacturing comprise wages, benefits, overhead, machinery, and facilities costs. Research and development involve innovating fibers, resins, and manufacturing processes. Transportation accounts for shipping to customers, while regulatory compliance covers adhering to production regulations. Maintenance and support encompass repairs and replacements. The application's nature also affects total costs, with aerospace FRP composites generally costlier than those in the automotive industry.

List of Key Suppliers in the Fiber Reinforced Plastics Category

  • Hexcel
  • Toray
  • Cytec
  • Teijin
  • TenCate
  • Mitsubishi Rayon
  • SGL Carbon
  • TenCate
  • Dupont
  • BASF

Fiber Reinforced Plastics Procurement Intelligence Report Scope

  • Fiber Reinforced Plastics Category Growth Rate: CAGR of 8% from 2023 to 2030 
  • Pricing Growth Outlook: 2% - 4% (Annually) 
  • Pricing Models: Unit Pricing, Cost-plus Pricing 
  • Supplier Selection Scope: Cost and pricing, Past engagements, Productivity and Geographical presence 
  • Supplier Selection Criteria: Quality Assurance, Supply Capacity and Reliability, Traceability and Transparency, Cost Competitiveness, and Certifications 
  • Report Coverage: Revenue forecast, supplier ranking, supplier matrix, emerging technology, pricing models, cost structure, competitive landscape, growth factors, trends, engagement, and operating model 

Brief about Pipeline by Grand View Research: 

A smart and effective supply chain is essential for growth in any organization. Pipeline division at Grand View Research provides detailed insights on every aspect of supply chain, which helps in efficient procurement decisions. 

Our services include (not limited to): 

  • Market Intelligence involving – market size and forecast, growth factors, and driving trends
  • Price and Cost Intelligence – pricing models adopted for the category, total cost of ownerships
  • Supplier Intelligence – rich insight on supplier landscape, and identifies suppliers who are dominating, emerging, lounging, and specializing
  • Sourcing / Procurement Intelligence – best practices followed in the industry, identifying standard KPIs and SLAs, peer analysis, negotiation strategies to be utilized with the suppliers, and best suited countries for sourcing to minimize supply chain disruptions

Uncovering the Key Drivers Shaping the Data Preparation Industry

Data Preparation Industry Data Book - Data Collection and Labelling, Data Labelling Solutions and Services & Data Integration Market Size, Share, Trends Analysis, And Segment Forecasts, 2023 - 2030

The global Data Preparation Industry was valued at USD 20.89 billion in 2021 and is anticipated to increase at a significant CAGR of 17.0% from 2022 to 2030.           

Grand View Research’s Data Preparation industry databook is a collection of market sizing information & forecasts, competitive benchmarking analyses, macro-environmental analyses, and regulatory & technological framework studies. Within the purview of the database, all such information is systematically analyzed and provided in the form of presentations and detailed outlook reports on individual areas of research.

Data Collection and Labelling Market Insights

The global data collection and labeling market size was valued at USD 1.67 billion in 2021 and it is expected to expand at a compound annual growth rate (CAGR) of 25.1% from 2022 to 2030. The market is expected to witness a surge in technology adoption owing to benefits such as extracting business insights from socially shared pictures and auto-organizing untagged photo collections. It also contributes to developing enhanced safety features in autonomous vehicles, such as condition monitoring, terrain detection, wear detection, and emergency vehicle detection.

Machine learning has been incorporated into various industries, including facial recognition on social networking websites, automated picture arrangement on visual websites, robotics, and drones. Social media monitoring is one of the most popular data collection applications, as visual listening and visual analytics are essential for digital marketing growth. Also, this technology is highly used in applications related to safety and security, such as data gathering for facial recognition used by law enforcement agencies. The need for a constant flow of data to evaluate is expanding as the importance of data-backed decisions for businesses increases. Analysts derive insights and information from data about their target clientele through data mining.

Artificial intelligence-enabled data labeling service is rapidly gaining traction in security monitoring technology in many countries. Person/object tracking, traffic monitoring, parking occupancy detection area monitoring, and vehicle analysis are some of the primary AI applications in surveillance settings. Many companies have invested much time developing AI-based data processing technologies to maintain social isolation in open spaces, especially during the global covid-19 epidemic.

Data Collection and Labelling Market share, by data type, 2021 (%)

Order your copy of the Free Sample of “Data Preparation Industry Data Book - Data Collection and Labelling, Data Labelling Solutions and Services & Data Integration Market Size, Share, Trends Analysis, And Segment Forecasts, 2023 - 2030” Data Book, published by Grand View Research

Data Labelling Solutions and Services Market Insights

The global data labeling solution and services market size was valued at USD 8.69 billion in 2021 and is projected to grow a CAGR of 21.0% from 2022 to 2030. By adding attribute tags, data labeling tools assist users in developing data value. Data labeling is a process for identifying raw data (text, videos images, etc.) and adding one or more significant and revealing labels to offer context. Machine learning has been incorporated in several industries, including facial recognition on social networking websites powered by data collection, automated picture organization of visual websites, and robots & drones. Prominent growth in the automotive business, particularly in self-driving vehicles, significantly fuels data labeling solutions and services. A self-driving vehicle has a multiplicity of sensors and networking devices that let the computer drive the vehicle.

The global data labeling solution and services market is expected to witness a surge in the adoption of the technology owing to assistance such as deriving business insights from socially shared photographs and auto-organizing untagged photo collections. Furthermore, data labeling technology is increasingly being used in autonomous vehicles, which is expected to contribute to significant growth in the automobile industry. With the help of this technology, self-driving cars can detect obstacles and notify the driver about the vicinity of walkways and guardrails. The technology is also capable of reading stoplights and road signs.

The emerging importance of data efficiency and the evolution of technology is allowing for new business innovations, economics, and infrastructure. These factors have contributed to the expansion of the data labeling market. The significant development of machine learning in automated data analytics is projected to increase demand for tools and solutions for autonomous data labeling in many data-driven applications. Furthermore, the emerging prominence of picture annotation is likely to advance retail, automotive, and healthcare operations, driving demand for data labeling technologies. Moreover, the high expenses involved with manually annotating complicated photos may limit the market's growth.

Go through the table of content of Data Preparation Industry Data Book to get a better understanding of the Coverage & Scope of the study

Data Preparation Industry Data Book Competitive Landscape

The market participants are implementing several organic and inorganic growth strategies, including new product launches, product modernizations, collaborations, corporate expansions, and acquisitions and mergers.

Key players operating in the Data Preparation Industry are:

  • Alegion
  • Amazon Mechanical Turk, Inc.
  • Appen Limited
  • Clickworker GmbH
  • CloudFactory Limited

Check out more Industry Data Books, published by Grand View Research

About Grand View Research

Grand View Research, U.S.-based market research and consulting company, provides syndicated as well as customized research reports and consulting services. Registered in California and headquartered in San Francisco, the company comprises over 425 analysts and consultants, adding more than 1200 market research reports to its vast database each year. These reports offer in-depth analysis on 46 industries across 25 major countries worldwide. With the help of an interactive market intelligence platform, Grand View Research helps Fortune 500 companies and renowned academic institutes understand the global and regional business environment and gauge the opportunities that lie ahead. 

Contact:

Sherry James
Corporate Sales Specialist, USA
Grand View Research, Inc.
Phone: 1-415-349-0058
Toll Free: 1-888-202-9519
Email: sales@grandviewresearch.com
Web: https://www.grandviewresearch.com/sector-reports-list
Follow Us: LinkedIn | Twitter

Exploring the Latest Innovations in Asset Management Software Industry

Asset Management Software Industry Data Book - Asset Performance Management, Enterprise Asset Management, Infrastructure Asset Management Market Size, Share, Trends Analysis, and Segment Forecasts, 2023 - 2030

The global Asset Management Software Industry was valued at USD 56.76 billion in 2022 and is anticipated to increase at a significant CAGR of 11.1% from 2023 to 2030.           

Grand View Research’s asset management software industry databook is a collection of market sizing information & forecasts, competitive benchmarking analyses, macro-environmental analyses, and regulatory & technological framework studies. Within the purview of the database, all such information is systematically analyzed and provided in the form of presentations and detailed outlook reports on individual areas of research.

Asset Performance Management Market Insights

The global asset performance management market size was valued at USD 19.32 billion in 2022 and is expected to expand at a compound annual growth rate (CAGR) of 12.0% from 2023 to 2030. The market is anticipated to witness significant growth during the forecast period on account of the increasing demand for digital solutions across various industries, such as oil & gas, manufacturing, and chemical, among others, for reducing operational expenses. APM system helps collect different kinds of data from all the assets, such as machinery, heavy equipment, and so on, using sensors. Through the integration of disparate data sources, the APM system builds a data analytics platform that provides a comprehensive view of all operational assets. Customers can utilize this information to improve asset management processes and prioritize maintenance activities.

The integration of the APM system with complementary solutions such as mobile solutions and geographic information system (GIS) solutions is enabling more efficient use cases of the APM system, thereby contributing towards steady market growth. Furthermore, APM systems in the market leverage industrial internet of things (IIoT) to provide equipment reliability. As equipment reliability is fundamental capability of the APM systems, there is an increasing attraction towards the systems from industrial sector.

APM is an integrated suite of solutions and services, which includes various software that are used to monitor aspects such as asset health and asset reliability. They are also used to plan strategies for asset maintenance and divestment. For instance, the Predix solution by General Electric includes different products such as APM Health, APM Reliability, APM Strategy, and APM Integrity. APM system provides various insights at the point of action to increase asset life, minimize unplanned repair work, decrease downtime; lower maintenance costs, and reduce the risk of equipment failure.

Order your copy of the Free Sample of “Asset Management Software Industry Data Book - Asset Performance Management, Enterprise Asset Management, Infrastructure Asset Management Market Size, Share, Trends Analysis, and Segment Forecasts, 2023 - 2030” Data Book, published by Grand View Research

Enterprise Asset Management Market Insights

The global enterprise asset management market size was valued at USD 5.74 billion in 2022 and is expected to grow at a compound annual growth rate (CAGR) of 16.9% from 2023 to 2030.  The market's growth is driven by a stronger emphasis on improving asset availability and reducing asset breakdowns that impair business operations. The enterprise asset management (EAM) market is expected to grow more rapidly due to the rising demand for a 360-degree view of assets, the elimination of compliance-related overheads, the integration of technologies such as IoT, AI, and analytics, and the ongoing use of IoT platforms and devices to sustain enterprise assets. The demand for cloud-based EAM setups has been affected by increased internet enterprise size adoption, rising data security concerns, and cell phones that empower and inform users about using highly effective software.

The EAM market is undergoing a substantial transformation with supplemental and new technologies. The Internet of Things (IoT), real-time analytics, augmented reality, Artificial Intelligence (AI), digital twins, and telematics are integrated with EAM deployments to assist with more profound insights into asset management. As a result, EAM is increasingly becoming an intelligent program capable of ingesting real-time data, interacting with devices, and providing sophisticated insights to engineers and operators. A maturing market and broad usage of cloud and micro-enterprise size architectures in EAM and facility management software are offering new potential for market growth.

Severalpublic sector organizations, such as government entities, municipalities, and public institutions, use EAM software to manage public infrastructure, facilitate predictive maintenance, ensure compliance, save costs, and improve citizen services. For instance, in August 2022, Infor, a cloud software company, upgraded Infor Public Sector (IPS) asset and work management software in the city of Calgary in Alberta, Canada. The upgrade allows mobility businesses in the city to capitalize on functionalities, including GIS data integration, mobile applications, and improved performance.

Go through the table of content of Asset Management Software Industry Data Book to get a better understanding of the Coverage & Scope of the study

Asset Management Software Industry Data Book Competitive Landscape

The companies are adopting several growth strategies, such as partnerships, mergers & acquisitions, and product launches, to stay afloat in the competitive industry.

Key players operating in the Asset Management Software Industry are:

  • AVEVA Group plc
  • Aspen Technology, Inc.
  • ABB Ltd
  • Aptean
  • Pitney Bowes Inc.

Check out more Industry Data Books, published by Grand View Research

About Grand View Research

Grand View Research, U.S.-based market research and consulting company, provides syndicated as well as customized research reports and consulting services. Registered in California and headquartered in San Francisco, the company comprises over 425 analysts and consultants, adding more than 1200 market research reports to its vast database each year. These reports offer in-depth analysis on 46 industries across 25 major countries worldwide. With the help of an interactive market intelligence platform, Grand View Research helps Fortune 500 companies and renowned academic institutes understand the global and regional business environment and gauge the opportunities that lie ahead. 

Contact:

Sherry James
Corporate Sales Specialist, USA
Grand View Research, Inc.
Phone: 1-415-349-0058
Toll Free: 1-888-202-9519
Email: sales@grandviewresearch.com
Web: https://www.grandviewresearch.com/sector-reports-list
Follow Us: LinkedIn | Twitter

Key Considerations for Plasticizers Procurement: Sourcing, Quality, and Sustainability

Plasticizers Category - Procurement Intelligence   The Plasticizers Category is anticipated to grow at a CAGR of 5.5% from 2023 to 2030. A...