What Emerging Technologies are Impacting Hydrochloric Acid Procurement?

Hydrochloric Acid Category - Procurement Intelligence 

The Hydrochloric Acid Category is anticipated to grow at a CAGR of 6.6% from 2023 to 2030. The rising usage of hydrochloric acid from various end-use industries such as food and beverages, dyes, pigments, steel pickling, water & wastewater treatment, and others is anticipated to drive the category growth. The category is mainly driven by demand in wastewater treatment to adjust pH levels and enhance water quality. A wide range of food products such as cold drinks, cereals, and corn syrups used in biscuits are processed using hydrochloric acid. 

Waterborne diseases are a major concern in African countries such as Nigeria. According to UNICEF 2022 report, around 70% of water at the time of consumption is contaminated. Additionally, the U.N. agency stated that contamination is the reason Nigeria has the world’s highest number of deaths due to waterborne diseases among children between five years old. To tackle such problems various government bodies such as UNICEF, and the World Bank are taking initiatives to help wastewater treatment projects in the region. Such initiatives are expected to boost the demand for hydrochloric acid used for water treatment. 

Order your copy of the Hydrochloric Acid Procurement Intelligence Report, 2023 - 2030, published by Grand View Research, to get more details regarding day one, quick wins, portfolio analysis, key negotiation strategies of key suppliers, and low-cost/best-cost sourcing analysis 

Buyers in the category, such as chemical manufacturers and industrial users, often purchase in bulk. However, they choose from typically multiple suppliers, which gives buyers some negotiation power. Prices are also influenced by factors like supply and demand dynamics and the cost of raw materials. Due to the harmful effects of acid on the environment, companies are obliged to follow safety protocols by various government agencies. For instance, according to the U.S. Food and Drug Administration, Section 182.1057 recognizes hydrochloric acid as safe when used as a neutralizing agent in accordance with good manufacturing practices. 

Raw material, labor, land and construction, machinery, utility, packaging, transportation, and others are some of the cost components involved in the production of the category. Hydrochloric acid is produced through various processes such as salt and sulphuric acid, the Mannheim process, and hydrogen and chlorine. The most used method is through hydrogen and chlorine. Raw material and labor costs account for a major part of the total cost. 

In terms of hydrochloric acid production, the hybrid model is a popular engagement model in the category, combining in-house and full-service outsourcing. Some suppliers opt for a partial outsourcing model. Companies outsource operations such as packaging, and transportation services. Employing an in-house team for a complete production line from procuring raw material to quality testing, packaging, and transportation can be beneficial for the company. Developing a strong relationship with suppliers of raw materials (hydrogen and chlorine) and ensuring the consistency and traceability of the supply chain is key to sourcing the category.

List of Key Suppliers in the Hydrochloric Acid Category

  • BASF
  • AGC Chemicals Americas
  • Vynova, Detrex Chemicals
  • Thermo Fisher Scientific
  • Kaneka Corporation
  • ERCO Worldwide
  • Oxy
  • Olin
  • Tata Chemicals

Hydrochloric Acid Procurement Intelligence Report Scope

  • Hydrochloric Acid Category Growth Rate: CAGR of 6.6% from 2023 to 2030 
  • Pricing Growth Outlook: 6%-7% (Annually) 
  • Pricing Models: Volume based Pricing; Competition based pricing 
  • Supplier Selection Scope: Cost and pricing, volume, production capacity, geographical presence, and compliance 
  • Supplier Selection Criteria: Quality, volume range offered, contract terms, delivery option, technology used, safety and environmental compliance, location and presence of supplier, and others 
  • Report Coverage: Revenue forecast, supplier ranking, supplier matrix, emerging technology, pricing models, cost structure, competitive landscape, growth factors, trends, engagement, and operating model 

Brief about Pipeline by Grand View Research: 

A smart and effective supply chain is essential for growth in any organization. Pipeline division at Grand View Research provides detailed insights on every aspect of supply chain, which helps in efficient procurement decisions. 

Our services include (not limited to): 

  • Market Intelligence involving – market size and forecast, growth factors, and driving trends
  • Price and Cost Intelligence – pricing models adopted for the category, total cost of ownerships
  • Supplier Intelligence – rich insight on supplier landscape, and identifies suppliers who are dominating, emerging, lounging, and specializing
  • Sourcing / Procurement Intelligence – best practices followed in the industry, identifying standard KPIs and SLAs, peer analysis, negotiation strategies to be utilized with the suppliers, and best suited countries for sourcing to minimize supply chain disruptions
What are the Profit Margins in the Licensed Sports Merchandise Industry?

Licensed Sports Merchandise Industry Data Book - Licensed Sports Apparel, Licensed Sports Footwear and Licensed Sports Toys & Games Market Size, Share, Trends Analysis, And Segment Forecasts, 2023 - 2030

The global Licensed Sports Merchandise Industry was valued at USD 21,806.0 million in 2022 and is anticipated to increase at a significant CAGR of 5.2% from 2023 to 2030.

Grand View Research’s Licensed Sports Merchandise industry data book is a collection of market sizing information & forecasts, regulatory data, reimbursement structure, competitive benchmarking analyses, macro-environmental analyses, and regulatory & technological framework studies. Within the purview of the database, all such information is systematically analyzed and provided in the form of presentations and detailed outlook reports on individual areas of research.

Licensed Sports Apparel Market Insights

The global Licensed Sports Apparel Market size was valued at USD 8,499.8 million in 2022 and is expected to grow at a compound annual growth rate (CAGR) of 5.4% from 2023 to 2030. The continuous innovation and introduction of new designs, materials, and technologies in sports apparel by manufacturers is a key factor driving the market growth. Advanced fabrics that offer comfort, performance-enhancing features, and stylish designs contribute to the popularity of licensed sports apparel. Incorporating cutting-edge technologies like moisture-wicking, temperature regulation, and compression attracts consumers, further driving the market growth. In addition, licensed sports apparel has become increasingly integrated into fashion and lifestyle trends. Sports jerseys, caps, sneakers, and athleisure wear have become popular streetwear and casual wear options. This broader acceptance and incorporation of licensed sports apparel into everyday fashion contribute to its growth and appeal among sports enthusiasts.

The rise of social media platforms has transformed the way fans engage with sports and apparel-related content. Athletes, influencers, and celebrities with large social media followings promote licensed sports apparel through sponsored posts and endorsements. These digital marketing strategies enhance visibility and create a desire among fans to own and wear the endorsed apparel. Additionally, licensed sports apparel often includes exclusive merchandise and limited-edition items. These products may feature special designs, commemorative elements, or unique collaborations, making them highly sought after by collectors and avid fans. Limited availability and the desire to own rare and distinctive apparel contribute to the market's growth.

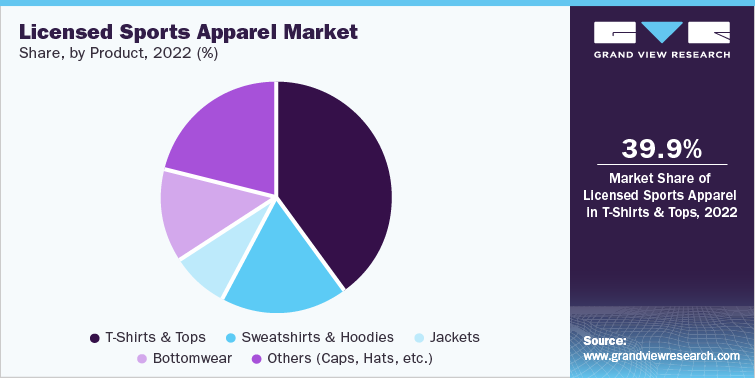
Licensed Sports Apparel Market Share, by Product, 2022 (%)

Order your copy of the Free Sample of “Licensed Sports Merchandise Industry Data Book - Licensed Sports Apparel, Licensed Sports Footwear and Licensed Sports Toys & Games Market Size, Share, Trends Analysis, And Segment Forecasts, 2023 - 2030” Data Book, published by Grand View Research

Licensed Sports Footwear Market Insights

The global Licensed Sports Footwear Market size was estimated at USD 3,339.6 million in 2022 and is expected to grow at a compound annual growth rate (CAGR) of 6.1% from 2023 to 2030. Licensed sports footwear is designed to enhance athletic performance. Footwear brands invest in research and development to incorporate advanced technologies, cushioning, stability, and traction features that improve comfort and performance, attracting athletes, sports enthusiasts, as well as sports fans increasing their adoption among them thus driving the market growth. In addition, nostalgia-driven designs and retro collections have a strong influence on the licensed sports footwear market. Footwear brands often release special editions and reissues of classic models and colorways associated with iconic sports moments or teams from the past. The nostalgia factor attracts fans who seek to relive sports history, contributing to the demand for licensed sports footwear.

Licensed sports footwear benefits from the reputation and quality assurance associated with established footwear brands. Consumers trust renowned brands for their expertise in designing and producing high-quality footwear thus driving the market growth. Moreover, sneaker culture, driven by collectors and enthusiasts, has extended to the licensed sports footwear market. Limited-edition releases, collaborations, and unique designs generate excitement among sneaker collectors and resellers. The collectability factor, driven by exclusivity and rarity, fuels demand and drives up the value of licensed sports footwear in the secondary market.

Go through the table of content of Licensed Sports Merchandise Industry Data Book to get a better understanding of the Coverage & Scope of the study

Licensed Sports Merchandise Industry Data Book Competitive Landscape

The manufacturers in the licensed sports merchandise industry aim to achieve optimum business growth and a strong market position through the implementation of various strategies such as acquisitions, new product launches, collaborations, and strengthening of distribution networks in the global as well as regional markets.

Key players operating in the Licensed Sports Merchandise Industry are:

  • VF Corporation
  • Nike, Inc.
  • Adidas AG
  • Puma SE
  • Under Armour, Inc.

Check out more Industry Data Books, published by Grand View Research

About Grand View Research

Grand View Research, U.S.-based market research and consulting company, provides syndicated as well as customized research reports and consulting services. Registered in California and headquartered in San Francisco, the company comprises over 425 analysts and consultants, adding more than 1200 market research reports to its vast database each year. These reports offer in-depth analysis on 46 industries across 25 major countries worldwide. With the help of an interactive market intelligence platform, Grand View Research helps Fortune 500 companies and renowned academic institutes understand the global and regional business environment and gauge the opportunities that lie ahead. 

Contact:

Sherry James
Corporate Sales Specialist, USA
Grand View Research, Inc.
Phone: 1-415-349-0058
Toll Free: 1-888-202-9519
Email: sales@grandviewresearch.com
Web: https://www.grandviewresearch.com/sector-reports-list
Follow Us: LinkedIn | Twitter

Uncovering the Key Players and Processes in the Blood Glucose Meters Industry Supply Chain Analysis

Blood Glucose Meters Industry Data Book - Point-of-care Glucose Testing Devices, Self-Monitoring & Continuous Blood Glucose Monitors Market Size, Share, Trends Analysis, And Segment Forecasts, 2023 - 2030

The global Blood Glucose Meters Industry was valued at USD 15.80 billion in 2022 and is anticipated to increase at a significant CAGR of 7.3% from 2023 to 2030.

Grand View Research’s blood glucose meters industry data book is a collection of market sizing information & forecasts, regulatory data, reimbursement structure, competitive benchmarking analyses, macro-environmental analyses, and regulatory & technological framework studies. Within the purview of the database, all such information is systematically analyzed and provided in the form of presentations and detailed outlook reports on individual areas of research.

Point-of-care Glucose Testing Market Insights

The global point-of-care glucose testing market size was valued at USD 3.2 billion in 2022 and is expected to grow at a compound annual growth rate (CAGR) of 3.7% from 2023 to 2030. The growing geriatric population, the ability of point-of-care (POC) diagnostic tests to deliver immediate results, thus providing improved patient care, and rising market penetration of electronic medical records (EMRs) are among the high-impact rendering drivers of this market. The shortage of skilled staff, especially in the field of diagnostics, is also expected to increase the market penetration of glucose POC diagnostic products.

Thus, diabetes management is one of the key priorities among healthcare professionals to limit the mortality rate. According to a survey by the Diabetes Research Foundation, diabetes increases the risk of a fatal outcome by 50% among COVID-19 patients. The growing awareness about diabetes management, poor healthcare access, scarcity of healthcare professionals, and the highest global prevalence recorded in Asian countries are likely to increase the adoption of PoC glucose testing solutions. This, in turn, creates an opportunity to reduce the healthcare burden by improving patient outcomes.

The introduction of favorable regulatory policies aimed at promoting PoC glucose diagnostics is expected to serve as a high impact rendering driver for the market. For example, in the U.S., the implementation of Clinical Laboratory Improvement Amendments (CLIA) is expected to boost usage rates during the forecast period. CLIA-waived tests are approved for use by healthcare providers operating in nontraditional laboratory sites, such as emergency rooms, physician offices, pharmacy clinics, health department clinics, and other healthcare facilities. The prevalence of diabetes is increasing worldwide, which is expanding the patient pool for the market.

Order your copy of the Free Sample of “Blood Glucose Meters Industry Data Book - Point-of-care Glucose Testing Devices, Self-Monitoring & Continuous Blood Glucose Monitors Market Size, Share, Trends Analysis, And Segment Forecasts, 2023 - 2030” Data Book, published by Grand View Research

Blood Glucose Monitors Market Insights

The global blood glucose monitoring devices market size was estimated at USD 12.53 billion in 2022 and is expected to grow at a compound annual growth rate (CAGR) of 8.1% from 2023 to 2030. The market is primarily influenced by the growing prevalence of diabetes and growing elderly population susceptible to conditions like diabetes. In addition, market growth is driven by rising awareness of preventive measures for diabetes and the introduction of new products. Diabetes, a widespread and growing global concern, is characterized by the pancreas' inability to efficiently produce insulin, leading to elevated blood glucose levels. According to the International Diabetes Federation, approximately 537 million individuals were diagnosed with diabetes in 2021, and projections indicate an anticipated rise to 643 million by 2030 and 783 million by 2045.

 Blood glucose monitoring (BGM) devices play a crucial role in supporting individuals with diabetes in numerous ways. Firstly, they empower both patients and healthcare professionals to identify elevated or reduced blood glucose levels, enabling timely adjustments to treatment plans. This capability serves as a protective measure by promptly confirming acute hypoglycemia or hyperglycemia, ensuring the well-being of patients. In addition, these devices enhance self-care practices, offering individuals greater control over their diabetes management. Moreover, the technology associated with blood glucose monitoring not only aids in immediate intervention but also serves as a valuable tool for patient education on diabetes and its effective management.

Go through the table of content of Blood Glucose Meters Industry Data Book to get a better understanding of the Coverage & Scope of the study

Blood Glucose Meters Industry Data Book Competitive Landscape

Technological advancements: especially in case of biosensors, Bluetooth integration, & real-time alerts, and price competitiveness are two of the major strategies mostly focused on by the major market players.

Key players operating in the Blood Glucose Meters Industry are:

  • Abbott Laboratories
  • Medtronic
  • Hoffmann-La Roche Ltd
  • Ascensia Diabetes Care
  • Lifescan Inc

Check out more Industry Data Books, published by Grand View Research

About Grand View Research

Grand View Research, U.S.-based market research and consulting company, provides syndicated as well as customized research reports and consulting services. Registered in California and headquartered in San Francisco, the company comprises over 425 analysts and consultants, adding more than 1200 market research reports to its vast database each year. These reports offer in-depth analysis on 46 industries across 25 major countries worldwide. With the help of an interactive market intelligence platform, Grand View Research helps Fortune 500 companies and renowned academic institutes understand the global and regional business environment and gauge the opportunities that lie ahead. 

Contact:

Sherry James
Corporate Sales Specialist, USA
Grand View Research, Inc.
Phone: 1-415-349-0058
Toll Free: 1-888-202-9519
Email: sales@grandviewresearch.com
Web: https://www.grandviewresearch.com/sector-reports-list
Follow Us: LinkedIn | Twitter

Clinical Research Organizations Procurement Supplier Intelligence Report, 2023 - 2030

Clinical Research Organizations Packaging Category - Procurement Intelligence 

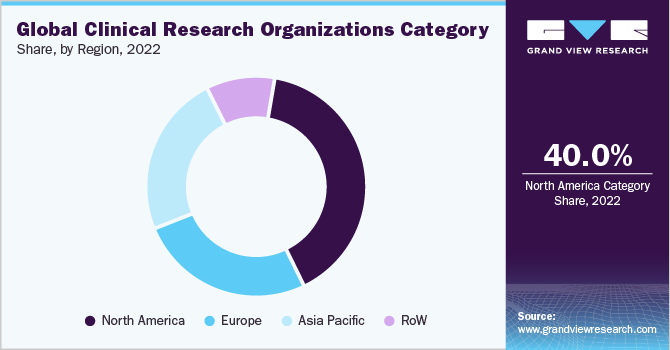
The Clinical Research Organization Category is expected to grow at a CAGR of 12.2% from 2023 to 2030. In 2022, North America held a 40% share of the market. This is linked to the region's concentration of large pharmaceutical corporations, which are also known for their extensive drug development efforts and first-rate healthcare systems. In addition, due to changes in the market and reimbursement from generic pharmaceuticals, a number of significant pharmaceutical businesses in this region are outsourcing R&D and clinical trials.

Clinical trials are complex and require many resources. Outsourcing clinical trials to CROs can help pharmaceutical and biotech companies reduce costs, streamline business operations, and increase productivity. As more pharmaceutical companies outsource their clinical studies, the demand for CROs is growing.

Global Clinical Research Organization Category Share, by Region, 2022

Order your copy of the Clinical Research Organizations Packaging Procurement Intelligence Report, 2023 - 2030, published by Grand View Research, to get more details regarding day one, quick wins, portfolio analysis, key negotiation strategies of key suppliers, and low-cost/best-cost sourcing analysis 

Companies are continuously focusing on collaborating or developing their own technology. For instance: 

  • In January 2023, a partnership between ICON plc and Google Cloud was announced in order to expedite the creation and distribution of clinical studies. Through the cooperation, ICON will be able to increase the effectiveness and efficiency of clinical trials by utilizing Google Cloud's artificial intelligence (AI) and machine learning (ML) capabilities.
  • In 2021, Charles River Laboratories agreed to purchase Cognate BioServices Inc., a contract development and manufacturing organization (CDMO) that specializes in cell and gene therapy. This acquisition is intended to help Charles River expand its scientific capabilities in the rapidly growing cell and gene therapy sector.

Category growth is expected to be fueled by the globalization of clinical trials and the demand for specialized services. The demand for specialized services is also being driven by the increasing number of rare diseases. These diseases affect a small number of patients, making it difficult to conduct clinical trials in traditional settings. CROs that can provide specialized services for rare diseases are well-positioned to capitalize on this growing market. 

Clinical Research Organizations Packaging Sourcing Intelligence Highlights 

  • The global clinical research organization category is fragmented, with the presence of several players in the market. To grow their market share, firms in the industry are adopting crucial strategies like research and development, acquisitions, partnerships, and regional expansion.
  • The cost of hiring staff, purchasing equipment, developing software, cost of data management, site monitoring, and regulatory compliance are the major cost component in clinical research organizations.
  • Most of the service providers offer study design and planning, clinical monitoring, biostatistics, and others.

List of Key Suppliers in the Clinical Research Organizations Packaging Category

  • Asymchem Laboratories (Tianjin) Co Ltd
  • Charles River Laboratories
  • Dalton Pharma Services
  • ICON plc
  • IQVIA Inc
  • Pharmaron Beijing Co Ltd
  • Piramal Enterprises Ltd
  • Sun Pharmaceutical Industries Ltd
  • Syneos Health
  • Thermo Fisher Scientific Inc

Clinical Research Organizations Packaging Procurement Intelligence Report Scope

  • Clinical Research Organizations Packaging Category Growth Rate: CAGR of 12.2% from 2023 to 2030 
  • Pricing Growth Outlook: 3% - 4% (Annually) 
  • Pricing Models: Cost Plus Pricing 
  • Supplier Selection Scope: Cost and pricing, past engagements, productivity, geographical presence 
  • Supplier Selection Criteria: Technical expertise, experience, cost and quality of service, capabilities, and reliability, research and development, customer service 
  • Report Coverage: Revenue forecast, supplier ranking, supplier positioning matrix, emerging technology, pricing models, cost structure, competitive landscape, growth factors, trends, engagement, and operating model 

Brief about Pipeline by Grand View Research: 

A smart and effective supply chain is essential for growth in any organization. Pipeline division at Grand View Research provides detailed insights on every aspect of supply chain, which helps in efficient procurement decisions. 

Our services include (not limited to): 

  • Market Intelligence involving – market size and forecast, growth factors, and driving trends
  • Price and Cost Intelligence – pricing models adopted for the category, total cost of ownerships
  • Supplier Intelligence – rich insight on supplier landscape, and identifies suppliers who are dominating, emerging, lounging, and specializing
  • Sourcing / Procurement Intelligence – best practices followed in the industry, identifying standard KPIs and SLAs, peer analysis, negotiation strategies to be utilized with the suppliers, and best suited countries for sourcing to minimize supply chain disruptions
What are the Current Trends Influencing the Cat Litter Industry Demand?

Cat Litter Industry Data Book - Clumping and Conventional Cat Litter Market Size, Share, Trends Analysis, and Segment Forecasts, 2023 - 2030

The global Cat Litter Industry was valued at USD 11.23 billion in 2022 and is anticipated to increase at a significant CAGR of 5% from 2023 to 2030.

Grand View Research’s cat litter industry data book is a collection of market sizing information & forecasts, trade data, pricing intelligence, competitive benchmarking analyses, macro-environmental analyses, and regulatory & technological framework studies. Within the purview of the database, such information is systematically analyzed and provided in the form of outlook reports (1 detailed sectoral outlook report) and summary presentations on individual areas of research.

Clumping Cat Litter Market Insights

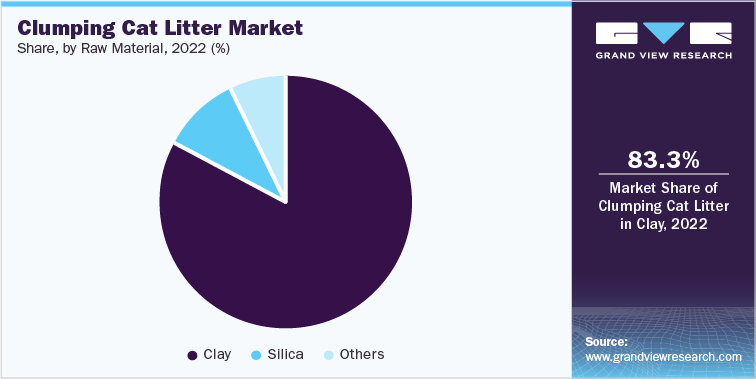
The global Clumping Cat Litter Market size was estimated at USD 8.56 billion in 2022 and is anticipated to grow at a compound annual growth rate (CAGR) of 5.3% from 2023 to 2030. Clumping cat litter offers a significant convenience advantage as it forms solid clumps when in contact with liquid waste. This makes it much easier for pet owners to scoop and remove the soiled litter from the litter box. The ability to quickly and efficiently clean the litter box saves time and effort, making clumping cat litter a popular choice for busy pet owners. Moreover, hygiene and cleanliness are also significant drivers for the adoption of clumping cat litter. The solid clumps formed by this type of litter can be easily removed, leaving behind clean litter for the cat to use. This regular removal of soiled litter helps to maintain a clean and sanitary environment in the litter box, reducing the risk of bacterial growth and unpleasant odors.

Consumers are more inclined to ease up the process of cleaning cat urine and feces through clumped litter owing to better scoopability and odor control. In addition, the rising availability of product varieties, including clay-based ultra and standard clumping, and biodegradable premium ultra-clumping, are likely increasing the adoption of clumping cat litter. Cat owners have the option to choose between the aforementioned product offerings, and their increasing availability is contributing to the segment’s growth.

Clumping Cat Litter Market Share, by Raw Material, 2022 (%)

Order your copy of the Free Sample of “Cat Litter Industry Data Book - Clumping and Conventional Cat Litter Market Size, Share, Trends Analysis, And Segment Forecasts, 2023 - 2030” Data Book, published by Grand View Research

Conventional Cat Litter Market Insights

The global Conventional Cat Litter Market size was valued at USD 2.66 billion in 2022 and is expected to register a growth of 4.3% from 2023 to 2030. Conventional cat litter tends to be more budget-friendly compared to specialized or alternative types of litter. This makes it an attractive option for pet owners who are cost-conscious or have multiple cats and need larger quantities of litter. According to a PetSafe site, the typical cost of clay-based conventional cat litter that requires to be replaced weekly is roughly USD 0.50., whereas, the average price of clumping litter is around USD 0.75 to USD 1.30. Clumping litter requires daily scooping with monthly replacement. The cost-effectiveness associated with conventional cat litter is expected to drive product sales in the market.

Another factor driving the adoption of conventional cat litter is its availability. Conventional litter is widely available in various stores and pet supply outlets, making it easily accessible to pet owners. The convenience of being able to purchase it locally or online without any specific requirements or limitations appeals to many cat owners. In addition, owing to increasing consumer awareness about health risks associated with dust particles, dust-free non-clumping litter is becoming popular among cat owners. Litters that minimize dust can help improve air quality in the home and reduce respiratory issues in both cats and their owners.

Go through the table of content of Cat Litter Industry Data Book to get a better understanding of the Coverage & Scope of the study

Cat Litter Industry Data Book Competitive Landscape

In the market, a mix of established companies and emerging players exists. Several prominent players are strategically capitalizing on the market's growing trends while expanding their range of services to sustain and increase their market share.

Key players operating in the Cat Litter Industry are:

  • Nestlé S.A.
  • The Clorox Company
  • Mars, Incorporated
  • Oil-Dri Corporation of America
  • Church & Dwight Co., Inc.

Check out more Industry Data Books, published by Grand View Research

About Grand View Research

Grand View Research, U.S.-based market research and consulting company, provides syndicated as well as customized research reports and consulting services. Registered in California and headquartered in San Francisco, the company comprises over 425 analysts and consultants, adding more than 1200 market research reports to its vast database each year. These reports offer in-depth analysis on 46 industries across 25 major countries worldwide. With the help of an interactive market intelligence platform, Grand View Research helps Fortune 500 companies and renowned academic institutes understand the global and regional business environment and gauge the opportunities that lie ahead. 

Contact:

Sherry James
Corporate Sales Specialist, USA
Grand View Research, Inc.
Phone: 1-415-349-0058
Toll Free: 1-888-202-9519
Email: sales@grandviewresearch.com
Web: https://www.grandviewresearch.com/sector-reports-list
Follow Us: LinkedIn | Twitter

A Guide to the Supply Chain Solutions Industry Vendor Landscape

Supply Chain Solutions Industry Data Book - Supply Chain Analytics, Procurement as a Service and Vendor Risk Management Market Size, Share, Trends Analysis, and Segment Forecasts, 2023 - 2030

The global Supply Chain Solutions Industry was valued at USD 20.45 billion in 2022 and is anticipated to increase at a significant CAGR of 15.0% from 2023 to 2030.

Grand View Research’s supply chain solutions industry data book is a collection of market sizing information & forecasts, competitive benchmarking analyses, macro-environmental analyses, and regulatory & technological framework studies. Within the purview of the database, all such information is systematically analyzed and provided in the form of presentations and detailed outlook reports on individual areas of research.

Supply Chain Analytics Market Insights

The global supply chain analytics market size was estimated at USD 6.13 billion in 2022 and is anticipated to grow at a compound annual growth rate (CAGR) of 17.8% from 2023 to 2030. The supply chain analytics (SCA) market is growing in demand due to increased awareness of the benefits of SCA solutions, such as forecasting accuracy, supply chain optimization, waste minimization, and meaningful synthesis of business data. The increasing number of small & medium enterprises and their increasing expenditure on implementing analytics to hold a strong position in the market and compete against other market players are expected to boost the market growth over the forecast period.

SCA helps organizations get a broader view of supply chain activities, allowing them to efficiently manage any issues that may impact the profitability or sustainability of the business. Mobile-based solutions help companies track inefficient supplier networks, elevated warehousing costs, and incorrect forecasts, among others. Analytics solutions also play a pivotal role in analyzing business operations that may help improve inventory management and subsequently help reduce associated cost components that may hinder business growth. In recent times, a surge in the adoption of mobile-based solutions is expected to create avenues for industry growth.

Unethical activities and increasing incidences of cyber threats could raise concerns among businesses and may challenge the adoption of SCA solutions to a certain extent. Although the prospects of tech inclusion in supply chain operations look bright, industry incumbents are still concerned about possible security/data breaches. These concerns may be unfavorable for future growth. However, by selling secure products, SCA solution providers have been working tirelessly to reduce the effect of these breaches. These initiatives may help the market grow at a healthy rate in the coming years.

Order your copy of the Free Sample of “Supply Chain Solutions Industry Data Book - Supply Chain Analytics, Procurement as a Service And Vendor Risk Management Market Size, Share, Trends Analysis, And Segment Forecasts, 2023 - 2030” Data Book, published by Grand View Research

Procurement as a Service Market Insights

The global procurement as a service market size was valued at USD 6.15 billion in 2022 and is expected to register a growth of 11.1% from 2023 to 2030. As firms increasingly rely on digitization to carry out their sourcing and procurement tasks while keeping track of company payments and purchases, procurement as a service is gaining popularity throughout the globe. Following the COVID-19 pandemic, the uptake of digitization in automating essential business operations like sourcing and procurement is receiving attention. This is anticipated to support the procurement growth as a service market throughout the projection period.

Sustainable procurement and supplier relationship management can become more proactive and effective with technology integration; this is expected to enable the economy of scale and boost corporate profitability. As a provider of procurement services, it is crucial to ensure that the newest technologies are used to help businesses anticipate greater accuracy regarding procurement and sourcing. Over the projected period, it is expected to maintain market demand for procurement as a service.

Service providers saw the shortcoming of the procurement service owing to the current epidemic, which has caused traditional procurement strategies to fail to scale and become unsustainable. The importance of global procurement services providing organizations has changed in light of this new status quo, moving away from negotiating service contracts and toward exclusive business alliances and strategic arrangements to guarantee both long- and short-term business. Similar to the supply side, business understanding of procurement procedures and services has grown significantly during the past few years. Custom service offers have evolved into a differentiator for service providers, promoting the expansion of procurement as a service industry.

Go through the table of content of Supply Chain Solutions Industry Data Book to get a better understanding of the Coverage & Scope of the study

Supply Chain Solutions Industry Data Book Competitive Landscape

The companies are adopting several growth strategies, such as partnerships, mergers & acquisitions, and product launches, to stay afloat in the competitive industry.

Key players operating in the Supply Chain Solutions Industry are:

  • Genpact
  • Accenture plc
  • International Business Machines Corporation
  • HCL Technologies Ltd.
  • WNS (Holdings) Ltd.

Check out more Industry Data Books, published by Grand View Research

About Grand View Research

Grand View Research, U.S.-based market research and consulting company, provides syndicated as well as customized research reports and consulting services. Registered in California and headquartered in San Francisco, the company comprises over 425 analysts and consultants, adding more than 1200 market research reports to its vast database each year. These reports offer in-depth analysis on 46 industries across 25 major countries worldwide. With the help of an interactive market intelligence platform, Grand View Research helps Fortune 500 companies and renowned academic institutes understand the global and regional business environment and gauge the opportunities that lie ahead. 

Contact:

Sherry James
Corporate Sales Specialist, USA
Grand View Research, Inc.
Phone: 1-415-349-0058
Toll Free: 1-888-202-9519
Email: sales@grandviewresearch.com
Web: https://www.grandviewresearch.com/sector-reports-list
Follow Us: LinkedIn | Twitter

Key Considerations for Strategic Synthetic Fiber Procurement Supplier Analysis

Synthetic Fibers Category - Procurement Intelligence 

The global Synthetic Fibers Category is anticipated to grow at a CAGR of 7.4% from 2023 to 2030. The majority of the global textile market is made up of synthetic fibers because of their affordability and functional qualities. In 2023, owing to its performance advantage over natural textiles, synthetic fibers currently account for more than 60% of all fiber usage globally. In contrast to materials like cotton, silk, or wool that are derived directly from plants or animals, synthetics are made wholly of chemicals. The most popular kinds are petroleum-based and include nylon, polyester, rayon, acrylic, and spandex. By material type, polyester is the most popular one and dominates the category accounting for 48 - 52% of the total fiber production in 2023. 

With an increasing focus on sustainability, one of the major trends has been the use of sustainable colorant solutions and functional additives (for chemicals, dyes, spin-dyeing, and finishes) for coloring and modification of the category in focus. The rising demand for synthetic fibers over natural fibers can be primarily attributed to their wide availability, and cost-effective prices, along with a wider range of applications across industries. Furthermore, the increasing demand for the product in many consumer goods, accessories, and apparel is driving the growth of the category. 

Order your copy of the Synthetic Fibers Procurement Intelligence Report, 2023 - 2030, published by Grand View Research, to get more details regarding day one, quick wins, portfolio analysis, key negotiation strategies of key suppliers, and low-cost/best-cost sourcing analysis 

The synthetic fibers category is fragmented. Textile manufacturers are increasingly engaging with regional players to gauge consumer behavior/preference patterns and capture a wider domestic market. Large companies such as Indorama, Mitsubishi, and Sinopec have integrated in-house manufacturing facilities that can produce the fibers from start to finish. Hence, the bargaining power of such specialized large-scale suppliers is moderately high. Regionally, there are numerous players based on different types of polymers which add to increased fragmentation and reduces the bargaining power to low. 

The key cost components include raw materials, energy, equipment and technology, labor, facilities, and marketing. Other costs can include legal and tax, indirect or overheads, repairs and maintenance of plants or facilities, transportation, etc. Synthetic fibers production needs a significant amount of crude oil and energy. Acrylonitrile is the key raw material for producing acrylic fabric. The synthetic insulating material known as fleece is made of polyethene terephthalate. Polyamides are needed to make nylon. Similarly, olefin is another material composed of fibers of polypropylene and polyethene. Hence, raw materials form a crucial cost component and any fluctuations in the cost of raw materials will dramatically impact the total cost of production.

List of Key Suppliers in the Synthetic Fibers Category

  • Bombay Dyeing
  • DuPont de Nemours, Inc.
  • Indorama Corporation
  • Lenzing AG
  • Mitsubishi Chemical Corporation
  • Sinopec Shanghai Petrochemical Co., Ltd
  • Toray Chemical Korea Inc.
  • Teijin Limited
  • Reliance Industries Limited
  • Toyobo Co., Ltd

Synthetic Fibers Procurement Intelligence Report Scope

  • Synthetic Fibers Category Growth Rate: CAGR of 7.4% from 2023 to 2030 
  • Pricing Growth Outlook: 10%-20% (Annually) 
  • Pricing Models: Volume-based, contract-based, and competitive pricing model 
  • Supplier Selection Scope: Cost and pricing, past engagements, productivity, geographical presence 
  • Supplier Selection Criteria: Production capacity, type of polymer, tensile strength, temperature resistance, moisture absorption, certifications, operational and functional capabilities, technology used, and others 
  • Report Coverage: Revenue forecast, supplier ranking, supplier positioning matrix, emerging technology, pricing models, cost structure, competitive landscape, growth factors, trends, engagement, and operating model 

Brief about Pipeline by Grand View Research: 

A smart and effective supply chain is essential for growth in any organization. Pipeline division at Grand View Research provides detailed insights on every aspect of supply chain, which helps in efficient procurement decisions. 

Our services include (not limited to): 

  • Market Intelligence involving – market size and forecast, growth factors, and driving trends
  • Price and Cost Intelligence – pricing models adopted for the category, total cost of ownerships
  • Supplier Intelligence – rich insight on supplier landscape, and identifies suppliers who are dominating, emerging, lounging, and specializing
  • Sourcing / Procurement Intelligence – best practices followed in the industry, identifying standard KPIs and SLAs, peer analysis, negotiation strategies to be utilized with the suppliers, and best suited countries for sourcing to minimize supply chain disruptions
Emerging Trends in the Business Software Industry: A Comprehensive Analysis

Business Software Industry Data Book - Event Management Software, ERP Software and Quality Management Software Market Size, Share, Trends Analysis, and Segment Forecasts, 2023 - 2030

The global Business Software Industry was valued at USD 71.11 billion in 2022 and is anticipated to increase at a significant CAGR of 11.3% from 2023 to 2030.

Grand View Research’s business software industry database is a collection of market sizing information & forecasts, competitive benchmarking analyses, macro-environmental analyses, and regulatory & technological framework studies. Within the purview of the database, all such information is systematically analyzed and provided in the form of presentations and detailed outlook reports on individual areas of research.

Event Management Software Market Insights

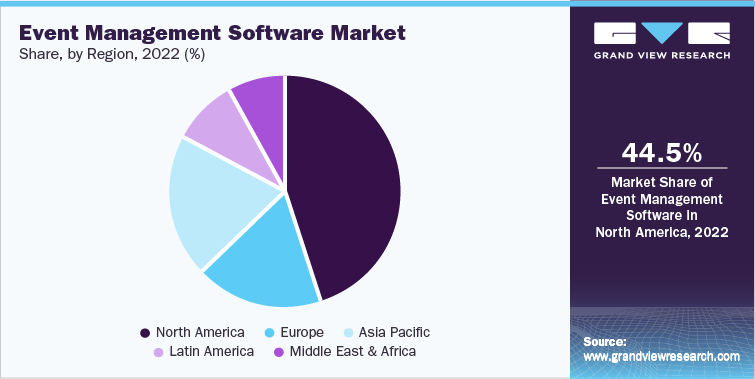
The global event management software market size was estimated at USD 6.96 billion in 2022 and is expected to grow at a compound annual growth rate (CAGR) of 14.1% from 2023 to 2030. With the proliferation of technology, event management software has strong data-handling attributes. It enables event managers to gather and evaluate data on participant population demographics, opinions, and behavior. The data gathered can assist event organizers in making informed choices, enhancing future events, and customizing overall experience to the needs of participants. These factors are driving market growth. Event management has grown in importance globally as the range of worldwide conferences, exhibits, and cultural events has increased. Cultural variations, communication hurdles, and foreign logistics are all managed by event organizers.

Event planners and organizers are using gamification as a tool to engage attendees. Gamification of events allows organizers to enhance experience for attendees. Gamification works on tailoring benefits to attendees' sentiments to boost their confidence, create a relaxed atmosphere, generate a feeling of common purpose, and ensure easy & effective communication. Event organizers typically use innovative gamification methods, such as Question and Answer (Q&A) engagement, social media engagement, teamwork games, social programs, and networking games.

Artificial Intelligence (AI) and Machine Learning (ML) are revolutionizing many elements of event management. AI-powered chatbots and digital assistants can answer guest inquiries, offer event details, and provide customized suggestions. Automation technologies can help companies reduce time by automating email marketing, social media time management, and statistical entry tasks. Interactive event engagements are gradually being created using AR and VR technologies. AR can provide fun and interactive elements by adding digital content to physical event venue. Attendees can utilize VR to discover virtual settings while participating in virtual presentations, outings, or games.

Event Management Software Market Share, by region, 2022 (%)

Order your copy of the Free Sample of “Business Software Industry Data Book - Event Management Software, ERP Software and Quality Management Software Market Size, Share, Trends Analysis, And Segment Forecasts, 2023 - 2030” Data Book, published by Grand View Research

ERP Software Market Insights

The global ERP software market size was valued at USD 54.76 billion in 2022 and is expected to expand at a compound annual growth rate (CAGR) of 11.0% from 2023 to 2030. The growing need for operational efficiency and transparency in business processes, the increase in demand for data-driven decisions, and the rise in mobile and cloud applications adoption are key factors propelling the ERP software market growth. However, the growing availability of open-source applications and higher initial investment and maintenance costs are poised to restrain the market growth. An increase in demand for cloud-based ERP solutions, especially from small and medium-sized businesses, is further anticipated to offer numerous opportunities for stakeholders in this market.

ERP implementation in an organization can reduce inventory costs by 25% to 30% and raw material costs by around 15%. Also, it leads to increased profitability for a firm, thus boosting demand. ERP facilitates integration of various organizational processes and the smooth flow of cross-functional information, thus allowing better productivity and decision-making. Moreover, a rising number of SMEs in developing economies, especially China, India, and Brazil, is expected to boost product demand. In addition, penetration of IT technologies in these regions is expected to change consumer behavior, leading to increased adoption of ERP software instead of manual operations.

Go through the table of content of Business Software Industry Data Book to get a better understanding of the Coverage & Scope of the study

Business Software Industry Data Book Competitive Landscape

Companies are adopting various growth strategies, such as mergers & acquisitions, partnerships, and new product launches to maintain their position in the competitive market.

Key players operating in the Business Software Industry are:

  • Aventri Inc.
  • General Electric Co.
  • Honeywell International Inc.
  • International Business Machines Corporation
  • Microsoft Corporation

Check out more Industry Data Books, published by Grand View Research

About Grand View Research

Grand View Research, U.S.-based market research and consulting company, provides syndicated as well as customized research reports and consulting services. Registered in California and headquartered in San Francisco, the company comprises over 425 analysts and consultants, adding more than 1200 market research reports to its vast database each year. These reports offer in-depth analysis on 46 industries across 25 major countries worldwide. With the help of an interactive market intelligence platform, Grand View Research helps Fortune 500 companies and renowned academic institutes understand the global and regional business environment and gauge the opportunities that lie ahead. 

Contact:

Sherry James
Corporate Sales Specialist, USA
Grand View Research, Inc.
Phone: 1-415-349-0058
Toll Free: 1-888-202-9519
Email: sales@grandviewresearch.com
Web: https://www.grandviewresearch.com/sector-reports-list
Follow Us: LinkedIn | Twitter

Exploring the Latest Advancements in Diagnostic Imaging Technology

Diagnostic Imaging Industry Data Book - Computed Tomography, Magnetic Resonance Imaging, Nuclear Imaging, Ultrasound Device and X-ray Systems Market Size, Share, Trends Analysis, and Segment Forecasts, 2023 - 2030

The global Diagnostic Imaging Industry was valued at USD 29.47 billion in 2022 and is anticipated to increase at a significant CAGR of 4.83% from 2023 to 2030.

Grand View Research’s diagnostic imaging industry data book is a collection of market sizing information & forecasts, regulatory data, reimbursement structure, competitive benchmarking analyses, macro-environmental analyses, and regulatory & technological framework studies. Within the purview of the database, all such information is systematically analyzed and provided in the form of presentations and detailed outlook reports on individual areas of research.

Computed Tomography Market Insights

The global computed tomography market size was estimated at USD 4.29 billion in 2022 and is expected to grow at a CAGR of 7.43% from 2023 to 2030. Technological advancements in computed tomography (CT) technology, coupled with the growing prevalence of chronic disorders, such as cancer, orthopedics, and cardiovascular & neurological conditions, are expected to accelerate market growth. Furthermore, increasing awareness and focus on preventive healthcare measures have led to a surge in routine diagnostic procedures, contributing to the expanding market for computed tomography. The introduction of CT has been of great benefit to medical care. This technology improves diagnoses, prevents unnecessary medical procedures, improves treatment by providing detailed anatomical imaging, and is a cost-effective imaging technique.

It is an essential diagnostics tool, especially for scanning bone, soft tissue, and blood vessels all at the same time. Since CT imaging is quick and easy during emergency cases, internal injuries can be detected early enough to save lives. Thus, increasing demand for advanced assessment tools in the emergency department and growing number of ambulatory emergency care units are the factors expected to have a positive impact on market growth. Technological advancements, such as the integration of artificial intelligence (AI) and the development of accessories to enhance image quality obtained by conventional CT scanners are the major factors expected to fuel market growth. For instance, in May 2023, Royal Philips launched an AI-powered CT scanner, Philips CT 3500 aiming at the need of routine radiology and high-volume screening programs.

The system is being launched at China International Medical Equipment Fair (CMEF 2023) and Deutscher Röntgenkongress (ROKO 2023), Germany in May 2023. In addition, In May 2021, Siemens Healthineers launched Somatom X. need CT scanner. It is a high-speed, high-resolution CT scanner with an intelligent operation approach that makes procedures easier for medical staff and patients. Also, in September 2021, GE Healthcare introduced a new CT system, Revolution Ascend which uses AI to improve operational efficiency and patient comfort. R&D activities remain competitive & flexible in healthcare owing to gradually advancing technologies & an uncertain economic environment. Companies are focusing on basic research to late-stage manufacturing of computed tomography technologies, using R&D efforts to gain a competitive edge.

Order your copy of the Free Sample of “Diagnostic Imaging Industry Data Book - Computed Tomography, Magnetic Resonance Imaging, Nuclear Imaging, Ultrasound Device and X-ray Systems Market Size, Share, Trends Analysis, And Segment Forecasts, 2023 - 2030” Data Book, published by Grand View Research

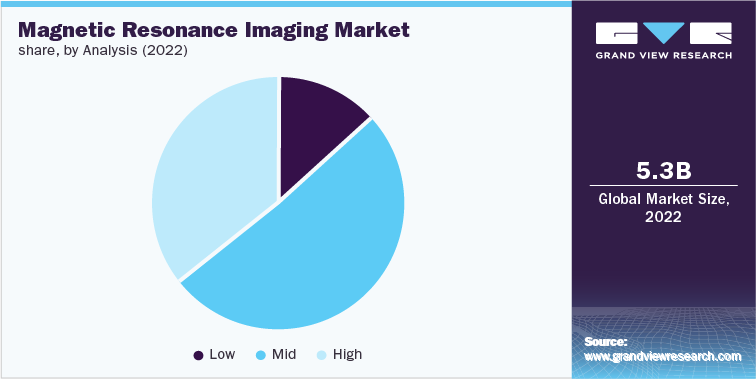
Magnetic Resonance Imaging Market Share Analysis (2022)

Magnetic Resonance Imaging Market Insights

The global magnetic resonance imaging market size was estimated at USD 5.25 billion in 2022 and is anticipated to grow at a compound annual growth rate (CAGR) of 6.81% over the forecast period. Magnetic resonance imaging (MRI) is a highly effective diagnostic tool for identifying conditions associated with spinal lesions, tumors, as well as strokes affecting blood vessels and the brain. The increasing prevalence of these diseases is expected to play an important role in the market growth. For instance, according to the National Center for Health Statistics, in 2023, almost 1,958,310 new cancer cases and 609,820 cancer deaths are estimated to occur in the U.S. In addition, the growing demand for quick and effective diagnostic procedures is expected to contribute to the adoption of MRI machines. Various countries are installing these machines.

Advancements in MRI machines to enhance their usage for various applications are expected to drive market growth during the forecast period. Various recent innovations, such as diffusion and diffusion tensor imaging with tractography, perfusion imaging, neuroimaging techniques including MR spectroscopy, and functional imaging employing the BOLD technique, are anticipated to significantly bolster magnetic resonance imaging market growth in the coming years. Furthermore, the increasing development of intraoperative MRI and its diverse applications in fields like neurosurgery are expected to drive market growth during the forecast period. In addition, diffusion-weighted MR imaging is primarily utilized for the rapid detection of strokes within 30 minutes of onset.

Therefore, ongoing advancements in MRI technology geared towards enhancing its utility across various applications are poised to be a driving force for market growth in the foreseeable future. Despite of various advantages associated with the MRI system, the costs incurred in buying and installing these machines are significant, which, in turn, is impacting the market growth, especially in the developing regions. The average cost of a low- to mid-strength machine is more than USD 1 million. In addition, the increasing requirement of depleting deposits of helium gas for cooling of MRI machines is resulting in increasing wait time and is reducing productivity. Delayed product approval and frequent product recalls, mainly due to stringent regulatory framework, are also majorly impacting the market growth.

Go through the table of content of Diagnostic Imaging Industry Data Book to get a better understanding of the Coverage & Scope of the study

Diagnostic Imaging Industry Data Book Competitive Landscape

Market leaders are constantly undertaking developmental initiatives such as acquisitions, partnerships, collaboration, and mergers to strengthen their market presence.

Key players operating in the Diagnostic Imaging Industry are:

  • FUJIFILM Corporation
  • Koning Corporation
  • Koninklijke Philips NV
  • NeuroLogica Corp
  • Neusoft Corporation

Check out more Industry Data Books, published by Grand View Research

About Grand View Research

Grand View Research, U.S.-based market research and consulting company, provides syndicated as well as customized research reports and consulting services. Registered in California and headquartered in San Francisco, the company comprises over 425 analysts and consultants, adding more than 1200 market research reports to its vast database each year. These reports offer in-depth analysis on 46 industries across 25 major countries worldwide. With the help of an interactive market intelligence platform, Grand View Research helps Fortune 500 companies and renowned academic institutes understand the global and regional business environment and gauge the opportunities that lie ahead. 

Contact:

Sherry James
Corporate Sales Specialist, USA
Grand View Research, Inc.
Phone: 1-415-349-0058
Toll Free: 1-888-202-9519
Email: sales@grandviewresearch.com
Web: https://www.grandviewresearch.com/sector-reports-list
Follow Us: LinkedIn | Twitter

Analyzing the Competitive Landscape of Blow Molding Plastic Packaging Procurement

Blow Molding Plastic Packaging Category - Procurement Intelligence 

The Blow Molding Plastic Packaging Category is expected to grow at a CAGR of 4.7% from 2023 to 2030. The Asia Pacific region accounts for the largest share of the category. The increasing demand for packaging processes in the business is boosting growth. Companies are focusing on adopting various technologies for efficient and eco-friendly production by reducing the wastage of materials and enhancing productivity. For instance, in 2022, Amcor used big data analytics to identify a way to reduce the amount of plastic used in its bottles by 10%.

Within this category, companies are using Artificial Intelligence (AI), IoT, and big data as it helps to automate repetitive tasks and enables them to collect and analyze data that can be analyzed and shared in real-time to improve efficiency and productivity by reducing errors. For instance, in 2022, Bekum Maschinenfabrik GmbH announced that it was using AI to automate the loading and unloading of molds.

Global Blow Molding Plastic Packaging Category Share (%), By Application, 2022

Order your copy of the Blow Molding Plastic Packaging Procurement Intelligence Report, 2023 - 2030, published by Grand View Research, to get more details regarding day one, quick wins, portfolio analysis, key negotiation strategies of key suppliers, and low-cost/best-cost sourcing analysis 

Companies are continuously focusing on partnering or developing their own technology. For instance: 

  • In 2022, PepsiCo announced that it would be using lighter-weight bottles for its Aquafina water brand. These bottles are made from 10% recycled content and are 15% lighter than the previous bottles. These are achieved through constant innovation in molding machines.
  • In 2022, Agr International introduced a new sensor that can measure the wall thickness of bottles in real-time, which can help to ensure that bottles meet the required specifications. This helps in reducing the defects during the blow mold process.
  • In May 2022, the U.S.-based plastic manufacturer - packaging company launched a new 32-cavity M3 micro molding machine which facilitates eight injection plunges that can be used for family mold applications. This helps them in producing a variety of items by utilizing the same machine in one cycle. The company has also the capability to produce miniature products which require complex designing and manufacturing.
  • Players are using features like high-cavitation molds, high-tonnage molding machines, and press-side automation to provide specialty packaging, including injection-molded lids and closures, stock extrusion blow-molded containers, and a wide variety of engineered custom products and assemblies to expel in the market. In 2021, the U.S.-based company Comar opened its largest facility to facilitate these features.
  • In 2021, the U.S.-based company Sealed Air announced to use 3D printing technology to create new blow-molded packaging for their food line products. Packaging designed using this technology is more sustainable and eco-friendlier than the traditional packaging method.

Category growth is expected to be fueled by the increasing packaging demand in varied industries. The utilization of blow-molding plastic packaging in the beverage industry is a key factor driving this trend. The rising demand is attributed to safety and precautionary measures to support health and hygienic factor. It reduces wastage by over 20% and also by increasing shelf life to protect nutritional values.

Blow Molding Plastic Packaging Sourcing Intelligence Highlights 

  • The global blow molding plastic packaging category is fragmented, with numerous small and large players operating in different regions. The competition between players is intense as they strive to gain a wider customer base and improve customer experiences.
  • The suppliers of this category have high bargaining power since raw materials constitute about 60% of the product. There is a significant impact on the prices of the category if the supplier raises the price.
  • Raw material, design, engineering, and manufacturing form the most significant cost component in category implementation. The overall cost also depends on the type of machine used such as Extrusion Blow, Injection Blow, and Injection Stretch Blow for production.
  • Most of the service providers offer complete services from designing development, quality check, and shipping of the product.

List of Key Suppliers in the Blow Molding Plastic Packaging Category

  • Niagara Bottling Llc
  • Petainer UK Holdings Ltd.
  • Nampak Plastics Europe Limited
  • Plastipak Packaging Inc.
  • Esterform Packaging
  • Plastic Technologies Inc.
  • Toyo Seikan Kaisha Ltd.
  • Graham Packaging Company Inc.
  • Logoplaste

Blow Molding Plastic Packaging Procurement Intelligence Report Scope

  • Blow Molding Plastic Packaging Category Growth Rate: CAGR of 4.7% from 2023 to 2030 
  • Pricing Growth Outlook: 10% - 15% 
  • Pricing Models: Cost plus pricing model, volume-based pricing model 
  • Supplier Selection Scope: Cost and pricing, past engagements, productivity, geographical presence 
  • Supplier Selection Criteria: By type, operating capability, quality measures, technology, certifications, regulatory compliance, and others 
  • Report Coverage: Revenue forecast, supplier ranking, supplier positioning matrix, emerging technology, pricing models, cost structure, competitive landscape, growth factors, trends, engagement, and operating model 

Brief about Pipeline by Grand View Research: 

A smart and effective supply chain is essential for growth in any organization. Pipeline division at Grand View Research provides detailed insights on every aspect of supply chain, which helps in efficient procurement decisions. 

Our services include (not limited to): 

  • Market Intelligence involving – market size and forecast, growth factors, and driving trends
  • Price and Cost Intelligence – pricing models adopted for the category, total cost of ownerships
  • Supplier Intelligence – rich insight on supplier landscape, and identifies suppliers who are dominating, emerging, lounging, and specializing
  • Sourcing / Procurement Intelligence – best practices followed in the industry, identifying standard KPIs and SLAs, peer analysis, negotiation strategies to be utilized with the suppliers, and best suited countries for sourcing to minimize supply chain disruptions
Analyzing the Distribution Channels in the Petrochemicals Industry: A Comprehensive Overview

Petrochemicals Industry Data Book - Ethylene, Propylene, Butadiene, Benzene, Xylene, Toluene and Methanol Market Size, Share, Trends Analysis, And Segment Forecasts, 2023 - 2030

The global Petrochemicals Industry was valued at 566.5 million tons in 2021 and is anticipated to increase at a significant CAGR of 5.1% from 2022 to 2030.

Grand View Research’s petrochemicals industry data book is a collection of market sizing information & forecasts, trade data, pricing intelligence, competitive benchmarking analyses, macro-environmental analyses, and regulatory & technological framework studies. Within the purview of the database, such information is systematically analyzed and provided in the form of outlook reports (1 detailed sectoral outlook report) and summary presentations on individual areas of research along with a statistics e-book.

Benzene Market Insights

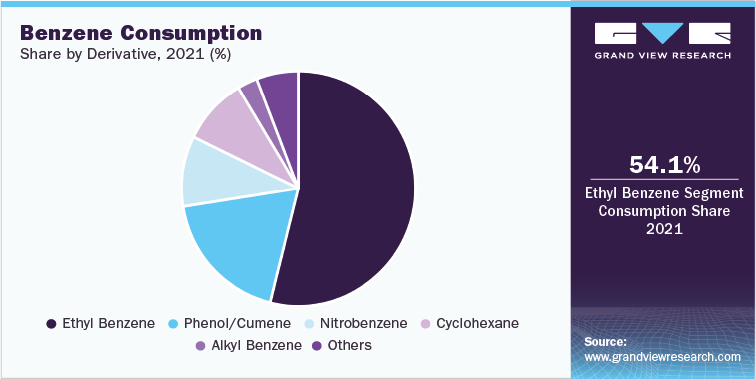
The global benzene market size was estimated at USD 55.8 million tons in 2021 and is expected to expand at a compounded annual growth rate (CAGR) of 4.1% from 2022 to 2030. The increasing demand for styrene in various end-use industries such as packaging, automotive, electronics, and others is acting as a major driving force for the continuously increasing demand for benzene. Styrene, produced from benzene’s derivative ethylbenzene, is used in a wide range of industries. The majority of the product goes into the production of polystyrene, which due to its flexibility, resilience, moisture resistance, and lightweight is used in the packaging industry.

The automotive industry is increasing continuously with the introduction of a new range of electric vehicles has also resulted in an increase in demand for benzene as styrene is used in the production of tires and several body parts of both diesel or gasoline-powered vehicles and electric vehicles.

According to Niti Aayog, India is among the fastest-growing country in the automotive sector witnessing a compounded annual growth rate of 4% from 2011 to 2020. Additionally, according to the National Bureau of Statistics of China in 2020, tire production in the country reached to 807.47 million. Thus, this increasing demand for automobiles in different countries is resulting in an increase in demand for benzene.

Benzene Consumption Share by Derivative, 2021 (%)

Order your copy of the Free Sample of “Petrochemicals Industry Data Book - Ethylene, Propylene, Butadiene, Benzene, Xylene, Toluene and Methanol Market Size, Share, Trends Analysis, And Segment Forecasts, 2023 - 2030” Data Book, published by Grand View Research

Xylene Market Insights

The global xylene market size was estimated at 60.4 million tons in 2021 and is projected to grow at a compound annual growth rate (CAGR) of 5.4% from 2022 to 2030. Xylene is a solvent and raw material widely utilized across various industries including paints and coatings, adhesives and sealants, pharmaceuticals, plastics, and textiles. The increasing demand for products and advancements within these industries plays a pivotal role in driving the growth of the market. In the paints and coatings industry, the market holds significant importance as it is extensively employed in formulating solvent-based paints, varnishes, and enamels. Its versatility as a solvent is crucial for achieving the desired performance characteristics in these coatings. Similarly, the adhesives and sealants industry heavily relies on these products as a solvent for bonding additives. Its ability to dissolve and facilitate the adhesion of different materials is instrumental in the formulation of high-quality adhesives and sealants.

Furthermore, the market plays a vital role in the production of various plastics, including polyesters and polyethylene terephthalate (PET). These plastics have widespread use in industries such as packaging, textiles, and automotive, further contributing to the demand for products. The growing demand for end-use products in these industries serves as a catalyst for the growth of the market. As industries continue to innovate and advance, the demand for the market is expected to rise in tandem with the market's evolving needs and requirements.

The demand for additives in the U.S. market is primarily fueled by their use as a solvent and as a constituent in various additives, such as monomers. The product serves as an important solvent in industries spanning from paints and adhesives to chemical manufacturing due to its exceptional solvency properties, making it highly effective in dissolving and mixing other substances.

Go through the table of content of Petrochemicals Industry Data Book to get a better understanding of the Coverage & Scope of the study

Petrochemicals Industry Data Book Competitive Landscape

Over the past years, This industry participants have been witnessed to continuously engage in acquisitions & mergers, and joint ventures with governments and other key players that are already in the field of oil and gas. By these operational integrations, companies seek to expand their reach to potential customers at optimum distribution cost.

Key players operating in the Petrochemicals Industry are:

  • BASF SE
  • Chevron Corporation
  • China National Petroleum Corporation (CNPC)
  • China Petrochemical Corporation (Sinopec)
  • Exxonmobil Corporation

Check out more Industry Data Books, published by Grand View Research

About Grand View Research

Grand View Research, U.S.-based market research and consulting company, provides syndicated as well as customized research reports and consulting services. Registered in California and headquartered in San Francisco, the company comprises over 425 analysts and consultants, adding more than 1200 market research reports to its vast database each year. These reports offer in-depth analysis on 46 industries across 25 major countries worldwide. With the help of an interactive market intelligence platform, Grand View Research helps Fortune 500 companies and renowned academic institutes understand the global and regional business environment and gauge the opportunities that lie ahead. 

Contact:

Sherry James
Corporate Sales Specialist, USA
Grand View Research, Inc.
Phone: 1-415-349-0058
Toll Free: 1-888-202-9519
Email: sales@grandviewresearch.com
Web: https://www.grandviewresearch.com/sector-reports-list
Follow Us: LinkedIn | Twitter

Is the Bioplastics Industry Profit Margin Sustainable for the Future?

Bioplastics Industry Data Book - Biodegradable Plastic, Polylactic Acid (PLA), Bio-based Polyurethane (PU) and Biopharma Plastics Market Size, Share, Trends Analysis, And Segment Forecasts, 2022 - 2030

The global Bioplastics Industry was valued at 2,470.6 kilotons in 2021 and is anticipated to increase at a significant CAGR from 2022 to 2030.

Grand View Research’s bioplastics sector data book is a collection of market sizing information & forecasts, trade data, pricing intelligence, competitive benchmarking analyses, macro-environmental analyses, and regulatory & technological framework studies. Within the purview of the database, such information is systematically analyzed and provided in the form of outlook reports (1 detailed sectoral outlook report) and summary presentations on individual areas of research along with an agricultural statistics e-book.

Biodegradable Plastic Market Insights

The global biodegradable plastic market size was estimated at 1,118.4 kilotons in 2021 and is expected to grow at a compound annual growth rate (CAGR) of 16.2% from 2022 to 2030. Governments prohibiting the use of single-use plastic coupled with rising awareness among the public regarding the ill effects of plastic waste are among the key trends stimulating market growth.

Additionally, increasing the use of biodegradable plastic in packaging and agriculture is anticipated to supplement the growth of the segment. Non-decomposable plastic is a global issue. Governments around the world are tackling this problem by banning single-use plastic and promoting the use of biodegradable plastic. Moreover, consumers are willing to pay more for biodegradable plastic owing to their eco-friendly nature. The aforementioned factors, cumulatively, are providing a fillip to the market.

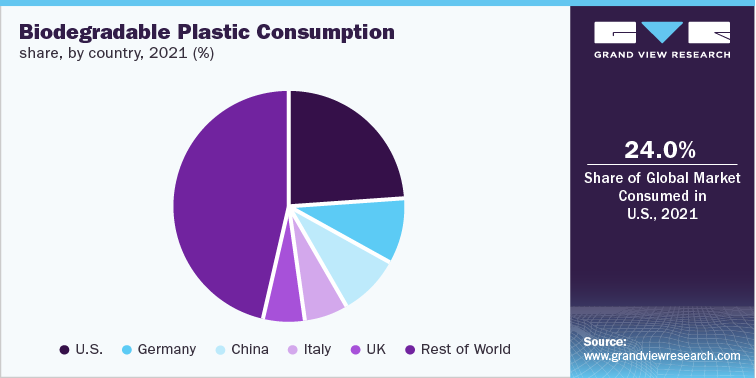
U.S. biodegradable plastic market is expected to rise significantly over the forecast period on account of the growing demand for bio-based packaging in food and consumer goods sectors. Bio bags and bio-based plastic have higher tensile strength, are eco-friendly in nature, and are convenient for use as compared to conventional plastic.

Biodegradable Plastic Consumption share, by country, 2021 (%)

Order your copy of the Free Sample of “Bioplastics Industry Data Book - Biodegradable Plastic, Polylactic Acid (PLA), Bio-based Polyurethane (PU) and Biopharma Plastics Market Size, Share, Trends Analysis, And Segment Forecasts, 2022 - 2030” Data Book, published by Grand View Research

Polylactic Acid (PLA) Market Insights

The global polylactic acid market size was estimated at 295.1 kilotons in 2021 and is expected to grow at a compound annual growth rate (CAGR) of 16.8% from 2022 to 2030. The growth of the PLA market is mainly driven by the growing demand for polylactic acid (pla) biodegradable resin in packaging across emerging economies such as China, India, Italy, and others. Bioplastics are environmentally friendly alternatives to traditional plastics, notably in flexible and rigid packaging applications, because they are bio-based, compostable, and biodegradable in nature. Bioplastics are materials in which all the carbon is derived from renewable Raw Materials such as algae, corn, sugarcane, bacteria, potatoes, seashells, and starch.

The growing transition toward developing energy-efficient vehicles and electric vehicles has pushed global automotive manufacturing companies toward including plastics in automotive components to reduce the overall weight of a vehicle. Thermoplastic plastic manufacturers are collaborating to develop plastics suitable for use in the automotive industry, which, in turn, is expected to drive the overall market growth.

PLA packaging provides an environment-friendly solution and helps in enhancing the appearance of the final product. PLA packaging has become an essential part of green packaging of various food products, which is likely to improve its growth prospects over the forecast period. The increasing utilization of bio-based plastics in flexible packaging is expected to fuel the growth of the polylactic acid market. Growing demand for food, on account of increasing global population, is one of the key trends augmenting the market growth.

Go through the table of content of Bioplastics Industry Data Book to get a better understanding of the Coverage & Scope of the study

Bioplastics Industry Data Book Competitive Landscape

Major players engage in mergers and acquisitions, expand their production facilities, develop infrastructure, invest in research and development facilities and find ways to vertically integrate their operations across the value chain.

Key players operating in the Bioplastics Industry are:

  • Toyota Tsusho Corporation
  • Avantium
  • PTT MCC Biochem Co., Ltd.
  • An Phat Holdings
  • NatureWorks LLC

Check out more Industry Data Books, published by Grand View Research

About Grand View Research

Grand View Research, U.S.-based market research and consulting company, provides syndicated as well as customized research reports and consulting services. Registered in California and headquartered in San Francisco, the company comprises over 425 analysts and consultants, adding more than 1200 market research reports to its vast database each year. These reports offer in-depth analysis on 46 industries across 25 major countries worldwide. With the help of an interactive market intelligence platform, Grand View Research helps Fortune 500 companies and renowned academic institutes understand the global and regional business environment and gauge the opportunities that lie ahead. 

Contact:

Sherry James
Corporate Sales Specialist, USA
Grand View Research, Inc.
Phone: 1-415-349-0058
Toll Free: 1-888-202-9519
Email: sales@grandviewresearch.com
Web: https://www.grandviewresearch.com/sector-reports-list
Follow Us: LinkedIn | Twitter

Are You Getting the Best Value? Understanding Energy-as-a-Service Procurement Costs

Energy-as-a-Service Category - Procurement Intelligence 

The Energy-as-a-Service Category is anticipated to grow at a CAGR of 9.20% from 2023 to 2030. North America is the leading market followed by Europe due to the rise in automation in manufacturing plants, renewable energy demand, and commercial industry growth. 

This category is driven by key drivers such as cost efficiency, scalability, flexibility, simplified IT management, access to advanced technologies, and innovation for organizations in today's dynamic business landscape. The key trends that are shaping its growth trajectory include the escalating energy demand driven by expanding industries, favorable energy regulations promoting EaaS adoption, the increasing integration of renewable energy sources to meet sustainability goals, the growing demand for flexibility to adapt to market changes, and the emphasis on energy efficiency to optimize resource utilization. 

This category is highly fragmented, with a large number of providers offering a variety of services. To dominate the category, major businesses use various tactics including providing a wide range of services, making investments in R&D, and purchasing smaller rivals. By doing this, they can develop their global footprint while also satisfying the market's growing need. 

Order your copy of the Energy-as-a-Service Procurement Intelligence Report, 2023 - 2030, published by Grand View Research, to get more details regarding day one, quick wins, portfolio analysis, key negotiation strategies of key suppliers, and low-cost/best-cost sourcing analysis 

Recent technological advancements include the development of smart meters, microgrids, and energy storage systems. These technologies have made it possible for category providers to offer more comprehensive and flexible energy solutions to businesses and consumers. For example, smart meters can help businesses and consumers track their energy usage in real-time, and microgrids can provide businesses with backup power during outages. Energy storage systems can also help businesses to store excess energy for use during peak demand periods. It is also important to note that the rising adoption of distributed energy resources (DER) in emerging nations is a significant contributor to the market's growth since they are both cost-effective and energy efficient. 

The key cost components include energy generation and distribution costs, maintenance and operations expenses, procurement and installation fees, financing charges, and additional services provided within this service package. Understanding these components is crucial for both service providers and customers in assessing the financial implications of adopting EaaS. Pricing in this category typically follows a pay-per-use model, considering factors such as energy demand, efficiency improvements, and operational savings achieved. The price section includes service pricing, base fee, usage costs, add-ons/upgrades, support and maintenance, implementation/onboarding costs, and contract terms. Achieving an optimal pricing and cost strategy is essential to provide value to customers while ensuring a profitable and sustainable business model for EaaS service providers.

List of Key Suppliers in the Energy-as-a-Service Category

  • Schneider Electric
  • Siemens
  • Engie
  • Honeywell International Inc.
  • Veolia, EDF
  • Johnson Controls
  • Bernhard
  • General Electric
  • Entegrity
  • Enel SpA,
  • NORESCO, LLC
  • Centrica plc
  • Wendel

Energy-as-a-Service Procurement Intelligence Report Scope

  • Energy-as-a-Service Category Growth Rate: CAGR of 9.20% from 2023 to 2030 
  • Pricing Growth Outlook: 3%-4% (Annually) 
  • Pricing Models: Subscription-based pricing model and pay-per-use pricing model 
  • Supplier Selection Scope: Technical capabilities, experience, pricing, and support to customers 
  • Supplier Selection Criteria: Capabilities and reliability, track record and pricing, performance guarantees, flexible pricing structures, diversifying sourcing strategies, and leveraging technology 
  • Report Coverage: Revenue forecast, supplier ranking, supplier matrix, emerging technology, pricing models, cost structure, competitive landscape, growth factors, trends, engagement, and operating model 

Brief about Pipeline by Grand View Research:

A smart and effective supply chain is essential for growth in any organization. Pipeline division at Grand View Research provides detailed insights on every aspect of supply chain, which helps in efficient procurement decisions. 

Our services include (not limited to): 

  • Market Intelligence involving – market size and forecast, growth factors, and driving trends
  • Price and Cost Intelligence – pricing models adopted for the category, total cost of ownerships
  • Supplier Intelligence – rich insight on supplier landscape, and identifies suppliers who are dominating, emerging, lounging, and specializing
  • Sourcing / Procurement Intelligence – best practices followed in the industry, identifying standard KPIs and SLAs, peer analysis, negotiation strategies to be utilized with the suppliers, and best suited countries for sourcing to minimize supply chain disruptions
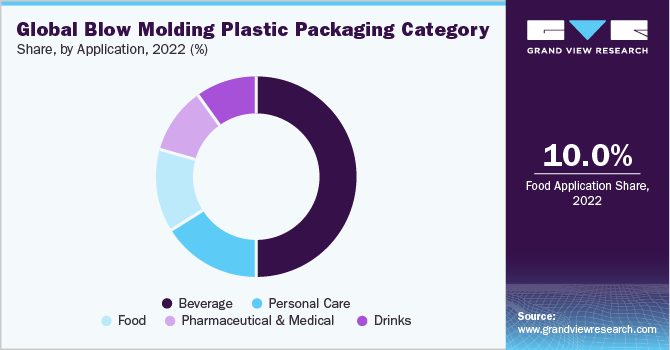
What Emerging Technologies are Impacting Hydrochloric Acid Procurement?

Hydrochloric Acid Category - Procurement Intelligence   The Hydrochloric Acid Category is anticipated to grow at a CAGR of 6.6% from 2023 ...