The global fiberglass market was valued at USD 20,273.7 million in 2024 and is projected to reach USD 28,258.9 million by 2030, growing at a CAGR of 5.9% from 2025 to 2030. The growth is primarily driven by the increasing demand for lightweight and durable materials in the automotive and aerospace sectors, which enhances fuel efficiency and performance.
Additionally, rising investments in renewable energy, particularly for wind turbine blades, are driving fiberglass usage. The construction industry’s focus on energy-efficient buildings, especially in emerging economies, further boosts demand. Technological advancements and sustainability initiatives are also key factors shaping market growth. Fiberglass is chemically stable, lightweight, and durable, and finds applications in industries such as marine, aerospace, electronics, automotive, plumbing, and storage solutions. Growing emphasis on reducing vehicle weight and improving fuel efficiency, alongside the rising need for insulation and composite materials, is expected to further stimulate market growth over the forecast period.
Key Market Trends & Insights
- Asia Pacific dominated the global market, accounting for the largest revenue share of 48.6% in 2024.
- Growth in the U.S. is driven by strong demand from the construction and automotive sectors.
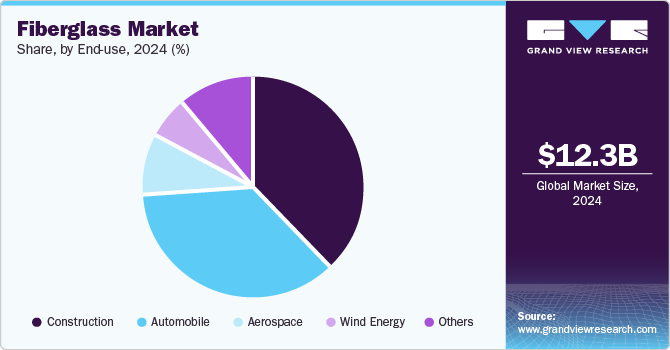
- By application, composites held the largest revenue share of 63.8% in 2024.
- By product type, glass wool led the market, accounting for 35.0% of revenue in 2024.
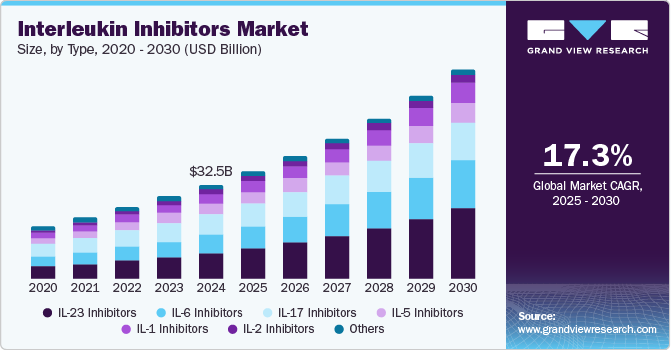
- By end-use, the automobile segment is projected to grow at a CAGR of 7.1% from 2025 to 2030.
Download a free sample PDF of the Fiberglass Market Intelligence Study by Grand View Research
Market Size & Forecast
- 2024 Market Size: USD 20,273.7 Million
- 2030 Projected Market Size: USD 28,258.9 Million
- CAGR (2025–2030): 5.9%
- Largest Market (2024): Asia Pacific
Competitive Landscape
Key players in the fiberglass market leverage strategies such as strategic collaborations, mergers and acquisitions, and new product launches to maintain competitiveness. These initiatives foster innovation, expand market reach, and optimize production efficiency, while aligning with sustainability trends and evolving consumer demands.
- Saint-Gobain offers a wide range of fiberglass solutions, including glass fiber mesh for insulation, wall coverings, and reinforcement grids for pavements. The company also operates in gypsum products, insulation, and high-performance construction materials, with a focus on energy efficiency and environmental responsibility.
- Jushi Group Co., Ltd. specializes in E-glass and S-glass fibers for construction, automotive, and aerospace applications. Its product portfolio includes fiberglass yarns, chopped strands, and woven fabrics to enhance composite materials’ performance. The company also produces resin systems and specialty composites, emphasizing innovation and quality.
Prominent Companies
- Owens Corning
- Saint-Gobain
- Nippon Electric Glass
- Jushi Group Co. Ltd.
- 3B-The Fiberglass Company
- PPG Industries
- Johns Manville
- Taishan Fiberglass, Inc.
- Chongqing Polycomp International Corp.
- Knauf Insulation
Explore Horizon Databook – the world’s most comprehensive market intelligence platform by Grand View Research.
Conclusion
The fiberglass market is poised for steady growth, driven by demand from automotive, aerospace, construction, and renewable energy sectors. Technological innovation, sustainability initiatives, and the increasing adoption of lightweight and durable materials will continue to shape the market landscape through 2030.